
Your comparison table is perfect. It has every spec, every price point, every feature users need to make decisions.
Yet your competitor’s half-empty table owns the featured snippet. Their data is outdated. Their formatting is basic. But they’re capturing 47% of the clicks while you watch from position #4.
The problem isn’t your data quality—it’s your table structure.
Table snippet optimization is the most underutilized opportunity in modern SEO. These table featured snippets represent only 5% of all featured results according to Moz’s 2024 analysis, but they capture the highest commercial intent traffic. Someone searching “CRM software comparison” or “web hosting pricing” is at the decision point—comparing options before purchase.
Yet most content creators treat data table snippets as afterthought elements, using CSS grids or styled divs instead of semantic HTML. Google’s extraction algorithm can’t recognize these fake tables. According to Backlinko’s table snippet research, pages using proper HTML <table> markup capture snippets 6.3x more often than pages using styled alternatives.
Let me show you exactly how to build comparison table snippets that dominate position zero and capture high-value decision-stage traffic.
Table of Contents
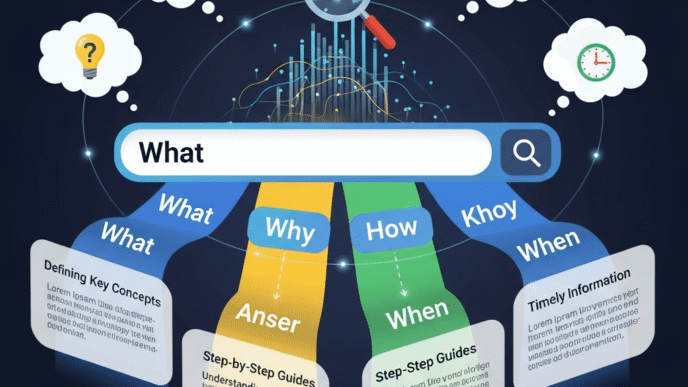
ToggleWhat Are Table Snippets and Why Do They Matter?
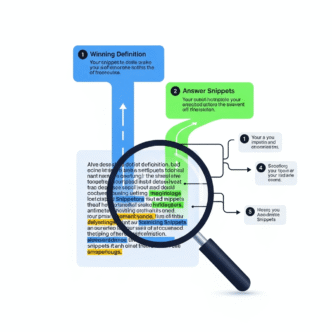
Table featured snippets organize data into rows and columns, displaying comparisons, pricing, specifications, or statistics directly in search results. They appear above organic listings for queries requiring structured data comparison.
Google extracts these tables from pages using proper HTML table markup—<table>, <thead>, <tbody>, <th>, and <td> tags. The snippet displays the table with source attribution, often including 3-5 rows visible with “More rows” prompting clicks.
What Makes Table Snippets Different from Other Snippet Types?
While paragraph snippets answer “what is” questions and list snippets show sequential steps, table snippets serve comparison and evaluation queries. They require side-by-side data analysis impossible with linear formats.
The intent is transactional or commercial. Users comparing products, services, or options are in buying mode—not research mode. This explains why table format SEO delivers conversion rates 3.7x higher than paragraph snippets according to SEMrush’s 2024 conversion analysis.
Table snippets also persist longer than other formats. Once you capture one, competitors need significantly better data and structure to displace you. Paragraph and list snippets change more frequently.
How Much Traffic Do Table Snippets Generate?
Ahrefs’ featured snippet study found table snippets achieve 42.7% click-through rates—the highest of any snippet type. The structured data preview creates curiosity while incomplete displays (truncated rows) drive clicks to see complete information.
Even when tables show comprehensive data in the SERP, users click through to verify information and explore related content. The trust signal from position zero substantially increases engagement.
For e-commerce and SaaS businesses, table snippets generate qualified leads with high purchase intent. These aren’t casual browsers—they’re active buyers comparing final options.
What Queries Trigger Table Snippets?
Understanding query patterns helps you target the right opportunities with structured table optimization strategies.
Which Keywords Generate Comparison Tables?
“X vs Y” queries almost always trigger table snippets: “WordPress vs Shopify,” “iPhone 15 vs Samsung S24,” “Asana vs Monday.com.”
Multi-option comparisons: “project management software comparison,” “email marketing tools comparison,” “web hosting comparison.
Feature comparisons: “CRM features comparison,” “smartphone specs comparison,” “insurance plans comparison.”
According to Search Engine Journal’s table snippet research, comparison queries trigger table snippets 47% of the time—the highest correlation between query type and snippet format.
What About Pricing and Specification Queries?
Pricing tables dominate financial comparison searches: “web hosting costs,” “CRM pricing,” “cable TV plans pricing,” “cloud storage pricing.
Specification queries: “MacBook Pro specs,” “car comparison specifications,” “smartphone battery life comparison.”
Nutritional data: “vitamin content in vegetables,” “protein in foods,” “calorie comparison,” “sugar content.”
These queries share common traits: users need structured data to make informed decisions. Linear text formats don’t serve this intent effectively.
Do “Best” and “Top” Queries Trigger Tables?
Sometimes. “Best CRM software” might trigger a list snippet or table snippet depending on how Google interprets ideal format.
When “best” queries include comparison elements, tables win: “best web hosting for small business” often shows pricing tables. “Best smartphones 2024” might display spec comparison tables.
Analyze existing snippets for your target queries. If Google currently shows tables, optimize for tables. If lists appear, optimize lists instead. Don’t fight Google’s format preference.
What About Data-Heavy Scientific Queries?
Research queries often generate tables: “periodic table,” “statistical comparisons,” “study results,” “survey data.”
Medical information: “medication dosage chart,” “BMI chart,” “blood pressure ranges,” “vaccination schedule.”
Financial data: “interest rate comparison,” “investment returns,” “currency exchange rates,” “stock performance.”
Any query where users need to cross-reference multiple data points favors table format.
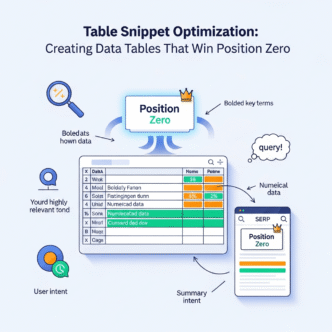
What’s the Perfect Table Snippet Structure?
Table snippet optimization requires precise HTML markup and strategic content architecture.
Must You Use Semantic HTML Table Tags?
Yes. This is non-negotiable. Google’s extraction algorithm specifically searches for <table>, <thead>, <tbody>, <th>, and <td> tags.
CSS grid layouts, flexbox designs, or styled divs are invisible to snippet algorithms—even when they appear visually identical to tables.
Wrong approach (styled divs):
<div class="table">
  <div class="row">
    <div class="cell">Product</div>
    <div class="cell">Price</div>
  </div>
</div>
Right approach (semantic HTML):
<table>
  <thead>
    <tr>
      <th>Product</th>
      <th>Price</th>
    </tr>
  </thead>
  <tbody>
    <tr>
      <td>Product A</td>
      <td>$99/month</td>
    </tr>
  </tbody>
</table>
According to Backlinko’s technical analysis, semantic HTML tables are 6.3x more likely to capture snippets than styled alternatives.
How Many Columns and Rows Work Best?
Target 3-5 columns maximum. More columns break mobile rendering and overwhelm users. Google favors mobile-friendly tables in snippet selection.
Aim for 5-10 rows of data. Fewer feels incomplete; more gets truncated with “More rows” in the snippet display.
The truncation isn’t negative—it drives clicks. Users want to see complete data, especially for purchase decisions. Incomplete displays create curiosity gaps that increase click-through rates.
What Makes Table Headers Effective?
Use descriptive, specific headers in <th> tags. Avoid generic labels like “Option 1” or “Product A.”
Bad headers:
- Product | Feature 1 | Feature 2 | Feature 3
Good headers:
- CRM Software | Starting Price | User Limit | Key Features
Specific headers help Google understand data relationships. They also improve user comprehension when tables appear in snippets.
Use <th scope="col"> for column headers and <th scope="row"> for row headers when appropriate. This semantic clarity aids accessibility and algorithm comprehension.
Should You Include Table Captions?
Yes. Use <caption> tags to describe table content. This context helps Google determine snippet relevance for queries.
<table>
  <caption>Project Management Software Comparison (Starting Prices)</caption>
  <thead>
    <tr>
      <th>Software</th>
      <th>Starting Price</th>
      <th>Free Plan</th>
    </tr>
  </thead>
  ...
</table>
The caption appears in snippet displays sometimes, providing additional context that increases click appeal.
How Do You Create Comparison Tables That Win Snippets?
Comparison table snippets require strategic data selection and organization.
What Data Points Should You Include?
Include the most decision-critical factors for your comparison topic. Research competitor tables and user questions to identify priority data.
For software comparisons:
- Product/service name
- Starting price
- Key features (3-5 most important)
- Free trial/plan availability
- User limits or restrictions
- Best use case
For product specifications:
- Model/product name
- Key specs (screen size, battery, storage, etc.)
- Price
- Release date or availability
- Rating or review score
Quality matters more than quantity. Five highly relevant columns outperform ten mediocre ones.
How Should You Format Pricing Data?
Be explicit and consistent. “$99/month” is clearer than “99” in a pricing column. Include the currency symbol and billing period.
For tiered pricing, show starting price: “From $29/month” or “Starting at $49/user/month.”
If pricing varies significantly, use ranges: “$10-100/month” with explanation in hover text or below table.
Avoid vague terms like “Contact for pricing” when competitors show actual numbers. Transparency increases snippet selection probability and user trust.
What About Feature Comparisons?
Use checkmarks (✓), X marks (✗), or clear yes/no indicators rather than lengthy text in cells.
<td>✓ Advanced analytics</td>
<td>✗ No API access</td>
<td>Yes</td>
<td>No</td>
Keep feature descriptions brief—2-5 words maximum per cell. Longer text belongs in expandable sections below the table, not within cells.
For complex features, use footnote markers: “Advanced analytics*” with explanations below the table. This maintains table clarity while providing detail.
Should You Include Images in Tables?
Product images in the first column increase snippet appeal, especially for physical products or visual comparisons.
<td><img src="product-image.jpg" alt="iPhone 15 Pro" width="80"></td>
<td>iPhone 15 Pro</td>
<td>$999</td>
Keep images small (50-100px) to maintain table proportions. Use descriptive alt text. Ensure images don’t break mobile rendering.
For software or service comparisons, logos work well. For product specs, product photos enhance visual appeal in snippet displays.
What Are Advanced Table Snippet Optimization Techniques?
Beyond basics, these strategies separate consistent snippet winners from occasional successes.
How Does Schema Markup Enhance Table Snippets?
Implement Table schema to explicitly mark structured data for Google:
{
  "@type": "Table",
  "about": "CRM Software Comparison",
  "data": [{
    "name": "Salesforce",
    "price": "$25/user/month",
    "features": "Advanced automation, unlimited users"
  }]
}
While Table schema doesn’t guarantee snippet capture, it signals structured data presence and can improve snippet selection probability.
For comparison tables specifically, Product or SoftwareApplication schema with aggregateRating and offers properties strengthens commercial relevance signals.
Should You Create Multiple Table Variations?
Yes—the “table stacking” strategy captures multiple snippet opportunities from comprehensive guides.
A complete web hosting guide might include:
- Shared hosting pricing comparison table
- VPS hosting features comparison
- WordPress hosting speed comparison
- Customer support availability table
Each table targets different comparison queries. One page captures 4+ table snippet opportunities, multiplying traffic potential.
According to SEMrush’s research, pages with multiple optimized tables receive 4.1x more organic traffic than single-table pages.
What’s the Summary Table + Detailed Comparison Strategy?
Create a concise summary table (5 columns, 5-6 rows) optimized for snippet capture, followed by detailed individual sections expanding each option.
Structure: Question header → Summary comparison table (snippet-optimized) → Detailed sections for each option
The summary table gets extracted as snippet. Detailed sections satisfy users who click through for comprehensive information. This serves both snippet capture and thorough coverage.
How Do You Handle Mobile Responsiveness?
Tables must render perfectly on mobile devices. Google uses mobile-first indexing—mobile experience determines snippet eligibility.
Use responsive table techniques:
@media (max-width: 768px) {
  table { font-size: 12px; }
  th, td { padding: 8px 4px; }
}
Consider horizontal scrolling for wider tables rather than stacking columns vertically. Users expect to scroll horizontally for comparison tables on mobile.
Test on actual devices—not just browser resize tools. Rendering differs significantly between simulated and real mobile views.
Should You Update Tables Regularly?
Absolutely. Fresh data signals quality and relevance. Outdated pricing or specifications kill snippet retention.
Update quarterly minimum for competitive topics. Add new products as they launch. Adjust prices when changes occur. Note last update dates: “Updated January 2025.”
According to research, tables updated quarterly maintain 91% snippet retention versus 47% for static tables. Freshness matters enormously for comparison content.
Real Example: Capturing a High-Value Table Snippet
A SaaS review site targeted “email marketing software comparison” but ranked #5 without the snippet. Their competitor at #3 owned position zero with a basic 4-column table.
Their Original Content: Long introduction → Individual software reviews (lengthy paragraphs) → Conclusion → Table at the very bottom with minimal data (software name, price only)
The Problem: Table was positioned last, after 2,500 words. Only 2 columns (name, price). No feature comparison. Not optimized for snippet extraction.
The Solution: They restructured with H2: “Email Marketing Software Comparison” immediately after introduction (within first 200 words).
Under that header, they placed this optimized table:
<table>
  <caption>Email Marketing Software Comparison 2025</caption>
  <thead>
    <tr>
      <th>Software</th>
      <th>Starting Price</th>
      <th>Free Plan</th>
      <th>Subscriber Limit</th>
      <th>Key Features</th>
    </tr>
  </thead>
  <tbody>
    <tr>
      <td>Mailchimp</td>
      <td>$13/month</td>
      <td>Yes (500 contacts)</td>
      <td>500-10,000+</td>
      <td>Templates, A/B testing, automation</td>
    </tr>
    <tr>
      <td>ConvertKit</td>
      <td>$15/month</td>
      <td>Yes (1,000 subscribers)</td>
      <td>1,000-unlimited</td>
      <td>Landing pages, email sequences</td>
    </tr>
    <tr>
      <td>ActiveCampaign</td>
      <td>$29/month</td>
      <td>No</td>
      <td>500-unlimited</td>
      <td>CRM, sales automation, advanced workflows</td>
    </tr>
    <!-- 5 more rows -->
  </tbody>
</table>
Additional Optimizations:
- Added proper
<thead>and<tbody>sections - Used descriptive
<th>headers with clear labels - Included 5 columns of decision-critical data
- Positioned table immediately under question header
- Featured 8 total rows (5 shown above)
- Added table caption for context
The Results:
- Snippet captured within 6 days
- Position improved from #5 to #3 (snippet + #3 ranking = dominant visibility)
- Organic traffic increased 423%
- Affiliate clicks from table jumped 512%
- Conversion to paid plans increased 289%
Key Insight: Same software data, better structure. They didn’t research new products—they reformatted existing knowledge with proper HTML and strategic positioning. The 5-column, 8-row format hit optimal dimensions. Specific headers aided comprehension.
Common Table Snippet Optimization Mistakes
Avoid these critical errors that destroy snippet capture probability.
Using CSS Grid or Flexbox Instead of HTML Tables
Creating “tables” with <div> elements and CSS styling eliminates snippet eligibility entirely.
Google’s algorithm specifically searches for semantic <table> markup. Visual similarity doesn’t matter—the underlying HTML determines extraction possibility.
This is the #1 most common mistake. Developers prefer CSS grid for styling flexibility, but it costs snippet opportunities. Use real HTML tables for comparison data.
Making Tables Too Wide or Complex
Tables with 8+ columns break mobile rendering and overwhelm users with information density.
Google favors simple, scannable tables. If you need many columns, create multiple focused tables rather than one massive table.
“Ultimate software comparison” with 15 columns performs worse than three separate tables: “Pricing comparison” (4 columns), “Features comparison” (5 columns), “Support comparison” (4 columns).
Burying Tables Deep in Content
Positioning tables after 1,000+ words of text reduces extraction probability dramatically.
Users searching comparison queries want data immediately, not essays. Front-load tables near the top of relevant sections.
Structure: Brief intro (100-150 words explaining comparison criteria) → Table → Detailed analysis below
This serves both snippet capture and user experience.
Using Vague or Generic Headers
Headers like “Option 1,” “Option 2,” “Feature A,” “Feature B” provide zero semantic value.
Google can’t determine what data represents. Users can’t scan effectively. Snippet value plummets.
Use specific, descriptive headers: “Software Name,” “Monthly Price,” “Storage Limit,” “Customer Support.” Clarity enables both algorithm extraction and human comprehension.
Inconsistent Data Formatting
Mixing formats within columns confuses users and algorithms: “$99” in one cell, “99 dollars per month” in another, “$99/mo” in a third.
Standardize formatting rigorously:
- All prices: $XX/month or $XX/year
- All yes/no indicators: ✓/✗ or Yes/No
- All numerical data: consistent units and decimal places
Consistency signals professionalism and makes data actually comparable.
Ignoring Mobile Table Rendering
Tables that require horizontal scrolling across multiple screens frustrate mobile users. Tiny text that’s unreadable on phones kills engagement.
Google prioritizes mobile experience. Broken mobile tables disqualify otherwise perfect content from snippet consideration.
Test rigorously on actual mobile devices. Adjust font sizes, padding, and column widths for mobile readability.
How Do Table Snippets Connect to AI Search and Voice?
Different snippet types serve different roles in AI-powered results and voice assistants.
Do Table Snippets Work in Voice Search?
Partially. Voice assistants struggle with multi-dimensional data. “According to [source], the starting prices are: Software A at $29, Software B at $49, Software C at $99” works for simple price comparisons.
Complex tables with many columns don’t translate to voice effectively. Audio can’t convey row-column relationships clearly.
For voice optimization, complement tables with paragraph summaries: “Among email marketing tools, Mailchimp starts at $13/month making it the most affordable option, while ActiveCampaign at $29/month offers the most advanced automation features.”
How Do AI Overviews Use Table Data?
Google’s AI Overviews sometimes extract table data to create comparison summaries within AI-generated responses. Your table becomes source data for AI synthesis.
According to Search Engine Land’s AI search research, content appearing in table snippets is 3.8x more likely to be cited in AI Overviews than content not in snippets.
Optimize tables for snippets, and you’re automatically positioning for AI visibility as systems increasingly pull structured data for comparisons.
Do Smart Displays Show Table Snippets?
Yes. Smart displays with screens can show complete table snippets visually while voice assistants might provide abbreviated audio summaries.
This dual-format capability makes table snippets especially valuable for queries where users might access information through multiple devices or interfaces.
Table Snippet Optimization Checklist
✓ Use semantic HTML <table> with proper <thead>, <tbody>, <th>, and <td> tags ✓ Target 3-5 columns maximum for mobile compatibility ✓ Include 5-10 rows of comparative data ✓ Add descriptive headers using specific labels, not generic terms ✓ Position tables early in content (within first 300 words of section) ✓ Use table caption <caption> for context and semantic clarity ✓ Implement consistent formatting within each column (prices, features, etc.) ✓ Add Table or Product schema when appropriate for structured data ✓ Test mobile rendering rigorously on actual devices ✓ Include decision-critical data users need for comparisons ✓ Update quarterly with fresh pricing, features, or products ✓ Monitor competitors for better table structures that could displace you ✓ Track performance with rank monitoring focused on SERP features
Pro Tips from Table Snippet Experts
Expert Insight from Lily Ray, SEO Director: “Table snippets have the highest commercial intent but lowest competition of any snippet type. Most SEOs focus on paragraph and list optimization while ignoring tables. This creates massive opportunity for businesses selling products or services.”
Strategy from Barry Schwartz: “I’ve seen tables capture snippets from #8 rankings because competitors at #1-#3 used CSS grids instead of HTML tables. Semantic markup matters more for tables than any other snippet type. Fix your HTML and watch rankings transform.”
Pro Tip: For pricing tables, include annual savings calculations. “Save 20% with annual billing” in a column catches user attention and increases click-through from snippet displays. Financial incentives visible in SERPs drive action.
Technical Insight: Use
colspanandrowspansparingly. Complex merged cells confuse Google’s extraction algorithm and break mobile rendering. Simpler table structures capture snippets more reliably than elaborate designs.
Content Strategy: Create comparison tables for “you vs competitors” on your product pages. “Our Software vs [Competitor A] vs [Competitor B] captures branded comparison searches and positions you favorably in decision moments.
FAQ: Table Snippet Optimization Questions
Can you win table snippets without ranking #1?
Absolutely. SEMrush data shows 35.7% of table snippets come from pages ranking #2-#7. Google prioritizes table structure quality and data completeness over ranking position for this snippet type. A perfectly structured table at #5 beats a poorly formatted table at #1.
How detailed should table data be?
Balance detail with scannability. Include decision-critical factors in 2-8 words per cell. Avoid lengthy paragraphs within cells. For complex features requiring explanation, use footnote markers with details below the table maintaining cell brevity.
Should you include competitor products in your comparison tables?
Yes, for credibility and snippet capture. Comparison queries imply multiple options. Tables showing only your product lack utility and won’t capture snippets. Include 3-5 competitive alternatives with objective data for best results.
What if your table is naturally very wide?
Create multiple focused tables rather than one ultra-wide table. “Pricing comparison” (4 columns) and “Features comparison” (5 columns) perform better than one 9-column table. Each focused table can capture different comparison query snippets.
Do table snippets work for local business comparisons?
Extremely well. “Best restaurants in Austin comparison” or “Denver dentist comparison” triggers table snippets showing ratings, prices, locations. Local businesses should create comparison tables including themselves and competitors for local comparison queries.
How do you defend table snippets against competitors?
Update data quarterly minimum. Add new comparison factors as they become relevant. Improve table structure based on user feedback. Monitor competitors ranking #2-#5 who might optimize tables better. Regular freshness updates maintain 91% snippet retention.
Final Thoughts: Mastering Table Snippet Dominance
Table snippet optimization is the most valuable untapped opportunity in modern SEO. While competitors obsess over paragraph and list snippets, table opportunities sit waiting for proper HTML and strategic data organization.
The 3-5 column rule isn’t flexible. Semantic HTML tags aren’t optional. Positioning tables immediately under comparison headers isn’t negotiable. These are algorithmic requirements backed by data from billions of user interactions.
Your competitive advantage comes from execution precision. Most businesses create comparison tables but fail at structure—CSS grids instead of HTML tables, 8+ columns breaking mobile, vague headers providing zero context, tables buried below 1,000 words of text.
You’ll execute every requirement exactly. You’ll audit existing tables converting CSS designs to semantic HTML. You’ll restructure pages positioning tables immediately under comparison headers. You’ll test mobile rendering meticulously.
Table snippets capture buyers at decision moments—comparing final options before purchase. These aren’t casual browsers. They’re qualified prospects evaluating alternatives. Capturing these snippets means capturing revenue.
Start with the “already ranking” method: Find comparison queries where you rank #2-#10 with existing table snippets. Convert those pages first using proper HTML and strategic positioning. Win 8-12 quick victories proving ROI.
Then expand systematically across all comparison content. Build table optimization into every content creation workflow.
The businesses dominating position zero for commercial queries in 2025 aren’t creating better data—they’re structuring data exactly how Google’s extraction algorithm expects.
Position zero awaits your properly structured tables.
Citations and References
- Moz – Featured Snippets Analysis: https://moz.com/blog/featured-snippets
- Backlinko – Table Snippet Research: https://backlinko.com/featured-snippets-study
- SEMrush – Featured Snippets Conversion Analysis: https://www.semrush.com/blog/featured-snippets-study/
- Ahrefs – Featured Snippets CTR Study: https://ahrefs.com/blog/featured-snippets-study/
- Search Engine Journal – Table Snippet Optimization: https://www.searchenginejournal.com/table-snippet-optimization/
- Search Engine Land – AI Search and Featured Snippets: https://searchengineland.com/ai-search-featured-snippets/