
Your organic traffic is up 300%. Your boss is thrilled. You’re celebrating.
Then someone from finance asks: “Great, but how much revenue did SEO actually generate?
Crickets.
Here’s the brutal truth about SaaS SEO metrics: Vanity numbers like total pageviews mean nothing if you can’t connect them to pipeline and revenue. I’ve watched countless marketing teams get their SEO budgets slashed because they couldn’t prove ROI—despite driving massive traffic.
Meanwhile, smart SaaS marketers track the right metrics, demonstrate clear attribution, and turn SEO into their most predictable revenue channel. According to <a href=”https://www.demandmetric.com/content/content-marketing-infographic” rel=”nofollow”>Demand Metric research</a>, organic search leads cost 61% less than outbound leads while converting at higher rates.
Today, I’m showing you exactly what SEO metrics matter for SaaS companies—from basic traffic to sophisticated revenue attribution. You’ll learn how to measure SEO success for B2B software in a way that proves value to your CFO.
Table of Contents
ToggleWhy Most SaaS Companies Track the Wrong SEO Metrics
Before diving into what to track, let’s talk about what NOT to obsess over.
Vanity metrics that mislead:
Total organic traffic: 100,000 monthly visitors sounds impressive, but what if they’re all looking for jobs at your company or reading unrelated blog posts? Traffic without qualification is meaningless.
Keyword rankings alone: Ranking #1 for 500 keywords is great—unless none of those keywords have commercial intent or target your ideal customer profile.
Pageviews and time on site: High engagement on blog posts doesn’t matter if readers never visit product pages or sign up for trials.
Domain authority scores: These are third-party metrics (Ahrefs DR, Moz DA) that correlate with rankings but don’t directly measure business impact.
Pro Tip: If you present SEO performance to executives and lead with “we’re ranking for 1,247 keywords,” you’ve already lost the room. Start with revenue impact, pipeline contribution, and qualified lead generation. Technical metrics come later as supporting evidence.
The Metrics Hierarchy for SaaS SEO
Think of SEO KPIs for SaaS in a hierarchy from foundational to business-critical.
Tier 1: Business Impact Metrics (what executives care about)
- Revenue from organic channel
- Marketing Qualified Leads (MQLs) from organic
- Cost per acquisition (CAC) from SEO
- Customer Lifetime Value (LTV) by channel
Tier 2: Conversion Metrics (what marketing cares about)
- Trial signups from organic traffic
- Demo requests from organic visitors
- Organic traffic to MQL conversion rate
- Content-assisted conversions
Tier 3: Performance Metrics (what SEO teams care about)
- Qualified organic traffic (to key pages)
- Keyword rankings for target terms
- Click-through rates from search
- Engagement on key content
Tier 4: Health Metrics (early indicators and diagnostics)
- Backlink growth
- Domain authority trends
- Technical SEO health score
- Indexation status
Understanding SaaS SEO fundamentals shows how metrics fit into your overall strategy.
What Are the Essential SEO Metrics for SaaS Companies?
Let me break down the tracking organic traffic metrics that actually matter.
1. Qualified Organic Traffic (Not Just Total Traffic)
This is your foundational metric—but with critical qualification.
What to track:
- Organic traffic to product pages
- Organic traffic to comparison pages
- Organic traffic to pricing page
- Organic traffic to high-intent blog posts
- Traffic by buyer journey stage
Why it matters: 10,000 visitors to your pricing page are infinitely more valuable than 100,000 visitors to random blog posts. Segment and prioritize accordingly.
How to set up in Google Analytics 4:
- Create custom segment: “Organic Traffic to High-Intent Pages”
- Include: Pricing, product features, comparison, demo, trial pages
- Exclude: Careers, about, general blog traffic
- Track this segment separately from total organic traffic
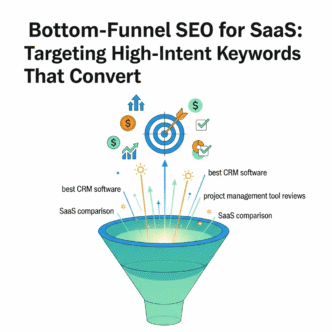
Pro Tip: Tag your pages by funnel stage (awareness, consideration, decision). Track organic traffic by stage to understand where SEO contributes most to the buyer journey. This reveals whether you’re capturing early research or bottom-funnel buying intent.
2. Organic Conversion Rate by Page Type
Different pages should convert at different rates. Track them separately.
Typical SaaS organic conversion benchmarks:
| Page Type | Expected Conversion Rate | Conversion Definition |
|---|---|---|
| Pricing Page | 3-7% | Trial signup or demo request |
| Comparison Pages | 5-10% | Trial signup or contact sales |
| Product Pages | 2-5% | Any conversion (trial, demo, email) |
| Use Case Pages | 2-4% | Trial signup or resource download |
| Blog Posts | 0.5-2% | Email signup or content download |
| Alternative Pages | 4-8% | Trial signup |
What this reveals: If your comparison pages convert at 1% (vs. expected 5-10%), you have a conversion problem, not a traffic problem. Fix the pages before driving more traffic.
How to track: Set up conversion goals in GA4 for each page type. Create custom reports showing conversion rates segmented by traffic source and page category.
3. Organic-Sourced Trials and Demos
The money metric for SaaS. How many qualified signups come from organic search?
What to track:
- Total trial signups from organic traffic
- Demo requests from organic traffic
- Trial-to-paid conversion rate by source
- Time from organic visit to trial signup
Why it matters: This bridges the gap between marketing metrics and revenue metrics. Trials and demos are your pipeline entry points.
Implementation:
- Use UTM parameters on all organic traffic (set up properly in GA4)
- Track “first touch” and “last touch” attribution
- Set up conversion tracking in your CRM
- Tag organic trials in your product analytics
Real example: Databox publicly shares that organic search drives 45% of their trial signups while representing only 30% of total traffic—proving organic’s superior quality over other channels.
4. Marketing Qualified Leads (MQLs) from Organic
Not all trials are equal. Track which organic visitors become qualified leads.
MQL criteria for SaaS typically include:
- Company size matches ICP
- Job title indicates decision-maker
- Engagement level (pages viewed, time on site)
- Content consumed (pricing, comparison pages)
- Trial activation (started using product)
What to measure:
- Total MQLs from organic channel
- Organic traffic to MQL conversion rate
- MQL cost from organic vs other channels
- Time to MQL from first organic visit
Pro Tip: Work with sales to define what makes a lead “qualified” for your business. An MQL definition of “anyone who entered an email” is useless. Focus on leads sales actually wants to talk to.
5. Organic Revenue Attribution
The ultimate metric: calculating ROI from SEO for SaaS requires revenue tracking.
Attribution models to use:
First-touch attribution:
- Credits organic for introducing the customer
- Good for understanding top-of-funnel impact
- Often undercredits organic’s role
Last-touch attribution:
- Credits channel that closed the deal
- Good for understanding conversion drivers
- Often overcredits bottom-funnel tactics
Multi-touch attribution:
- Credits all touchpoints in the journey
- Most accurate picture of organic’s contribution
- Requires sophisticated analytics setup
What to track:
- Revenue from customers acquired via organic
- Average contract value by acquisition channel
- Customer lifetime value by source
- Payback period by channel
Learning about keyword research strategies helps you target terms that drive revenue, not just traffic.
How Do You Calculate ROI from SEO for SaaS?
Let’s get into the actual math of measuring SEO ROI.
The Basic SEO ROI Formula
ROI = (Revenue from SEO – Cost of SEO) / Cost of SEO × 100
Sounds simple, but the details matter.
Calculating “Revenue from SEO”:
Method 1: Direct attribution (conservative)
- Count only customers whose first touch was organic
- Easy to track, understates impact
- Use for minimum ROI calculations
Method 2: Multi-touch attribution (accurate)
- Credit organic for all touches in customer journey
- Requires marketing analytics platform
- Best represents true impact
Method 3: Incremental revenue (comprehensive)
- Compare revenue before and after SEO investment
- Isolate SEO impact from other factors
- Use for long-term program evaluation
Calculating “Cost of SEO”:
Include everything:
- Team salaries (in-house SEO specialists)
- Agency or freelancer fees
- Content creation costs
- Tools and software (Ahrefs, SEMrush, etc.)
- Technical development for SEO improvements
- Opportunity cost of engineering time
Pro Tip: Most SaaS companies forget to include fully-loaded costs. That $5K/month agency fee becomes $8K+ when you add tools, content, and internal team time. Calculate true costs for accurate ROI measurement.
Example ROI Calculation
SaaS Company Scenario:
- Monthly SEO cost: $10,000 (agency + tools + internal time)
- Annual SEO investment: $120,000
Results after 12 months:
- Organic trials: 500 per month
- Trial to paid conversion: 15%
- Customers from organic annually: 900
- Average annual contract value: $5,000
- Annual revenue from organic: $4,500,000
ROI Calculation: ROI = ($4,500,000 – $120,000) / $120,000 × 100 ROI = 3,650%
Payback period: 0.3 months (basically immediate)
This is a mature SEO program. Early-stage programs show much lower ROI initially, then compound over time.
Tracking Long-Term SEO Value
SEO’s value compounds, making single-period ROI calculations misleading.
What to track over time:
- Year 1 ROI vs Year 2 ROI vs Year 3 ROI
- Content created in Year 1 that still drives conversions in Year 3
- Cumulative revenue from all historical SEO efforts
- Declining customer acquisition costs as organic scales
Real example: According to <a href=”https://www.hubspot.com/marketing-statistics” rel=”nofollow”>HubSpot’s data</a>, companies that blog consistently see 434% more indexed pages and 97% more inbound links—but these benefits compound over 2-3 years, not months.
Understanding content marketing strategy helps you create assets with long-term ROI potential.
What Are the Best SEO Analytics Tools for Software Companies?
You need the right stack to track SEO analytics for software effectively.
Essential Tool Stack for SaaS SEO Metrics
| Tool | Primary Use | Cost | Best For |
|---|---|---|---|
| Google Analytics 4 | Traffic, behavior, conversions | Free | Foundation of all tracking |
| Google Search Console | Rankings, clicks, impressions | Free | Google’s direct data |
| Ahrefs | Rankings, backlinks, competitors | $99-999/mo | Comprehensive SEO intelligence |
| SEMrush | Keyword tracking, competitive | $119-449/mo | Competitive analysis focus |
| Mixpanel/Amplitude | Product analytics | $0-2000+/mo | Post-signup behavior tracking |
| HubSpot/Salesforce | CRM and attribution | Varies | Pipeline and revenue attribution |
| Looker/Tableau | Data visualization | Varies | Executive reporting dashboards |
Setting Up Proper Tracking Infrastructure
Step 1: Implement comprehensive UTM tracking
Every organic visit should have source tracking:
- Source: google, bing, duckduckgo
- Medium: organic
- Campaign: (optional) specific initiatives
- Content: (optional) specific pages or tests
Step 2: Connect analytics to CRM
This is non-negotiable for B2B SaaS. Your GA4 data must flow into your CRM to track:
- Which organic visitors become leads
- Which leads become customers
- Revenue attributed to organic channel
- Full customer journey visibility
Step 3: Set up conversion tracking for all key actions
Track as events in GA4:
- Trial signup
- Demo request
- Pricing page view
- Comparison page view
- Resource download
- Product page visits
- Key feature page engagement
Step 4: Create custom dashboards
Build separate views for:
- Executive summary (revenue, MQLs, ROI)
- Marketing overview (traffic, conversions, content performance)
- SEO team details (rankings, technical health, opportunities)
Pro Tip: Use Google Analytics 4’s “Explorations” feature to create custom funnels showing: Organic visit → Product page → Pricing page → Trial signup → Paid customer. This visualizes the entire customer journey from SEO.
How Do You Track Organic Conversions in SaaS Accurately?
Tracking organic conversions in SaaS requires understanding attribution challenges.
The SaaS Attribution Problem
B2B SaaS buyers don’t convert linearly. A typical journey looks like:
- Day 1: Find your blog via Google search
- Day 5: Return directly to blog via bookmark
- Day 12: Search your brand name, visit pricing
- Day 20: Click email nurture campaign, sign up for trial
- Day 50: Convert to paid via retargeting ad
Which channel gets credit? Depends on your attribution model.
Attribution Models for SaaS SEO
First-touch attribution:
- Organic gets 100% credit for introducing customer
- Pros: Easy to implement, shows top-funnel impact
- Cons: Ignores nurture and conversion touchpoints
- Best for: Understanding awareness generation
Last-touch attribution:
- Last interaction before conversion gets credit (ad in example above)
- Pros: Shows conversion drivers
- Cons: Ignores how customer discovered you
- Best for: Short-term campaign optimization
Linear attribution:
- Equal credit to all touchpoints
- Pros: Acknowledges full journey
- Cons: May overweight insignificant touches
- Best for: Understanding journey complexity
Time-decay attribution:
- More credit to touchpoints closer to conversion
- Pros: Balances discovery and conversion
- Cons: May undervalue early awareness
- Best for: Most SaaS companies (recommended)
Position-based (U-shaped) attribution:
- 40% credit to first touch, 40% to last, 20% distributed
- Pros: Credits discovery and conversion equally
- Cons: May overweight first/last arbitrarily
- Best for: Understanding key moments
Pro Tip: Use multiple attribution models simultaneously. Report first-touch to show organic’s awareness impact, last-touch to show conversion drivers, and time-decay for “true” revenue attribution. Different stakeholders care about different models.
Setting Up Multi-Touch Attribution
Option 1: Native platform attribution (basic)
- Use GA4’s built-in attribution reports
- Free but limited customization
- Good starting point for most SaaS companies
Option 2: Marketing attribution platforms (advanced)
- Tools like HubSpot Attribution, Bizible, DreamData
- $500-5000+/month typically
- Full customer journey tracking across all channels
Option 3: Custom data warehouse (enterprise)
- Build your own attribution in Snowflake/BigQuery
- Unlimited customization, full control
- Requires data engineering resources
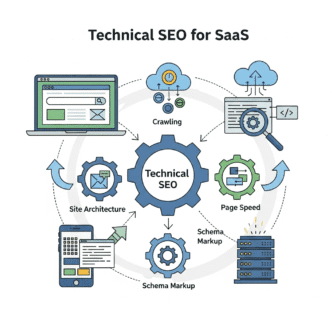
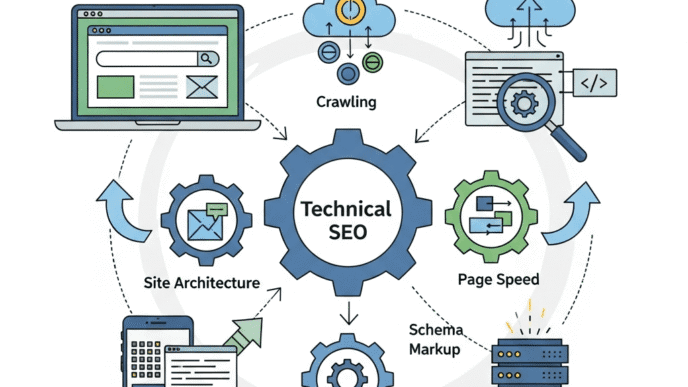
Learning about technical SEO requirements ensures proper tracking implementation.
What Content Performance Metrics Should You Track?
Beyond overall SEO metrics, track individual organic revenue tracking at the content level.
Content-Level Metrics That Matter
For each piece of content, track:
Traffic metrics:
- Organic sessions
- Unique organic visitors
- Traffic trend (growing, stable, declining)
- Ranking keywords driving traffic
Engagement metrics:
- Average time on page
- Scroll depth
- Pages per session (from entry)
- Bounce rate vs site average
Conversion metrics:
- Conversion rate (email, trial, demo)
- Total conversions generated
- Assisted conversions (content viewed in journey)
- Revenue influenced or generated
SEO performance:
- Ranking positions for target keywords
- Featured snippet captures
- Click-through rate from search
- Backlinks earned
Content Performance Tiers
Segment content into performance tiers:
Tier 1: Money-makers (5-10% of content typically)
- Drive 50%+ of organic conversions
- Highest revenue attribution
- Maintain and optimize religiously
- Update quarterly minimum
Tier 2: Traffic drivers (15-25% of content)
- High traffic, moderate conversion
- Build authority and awareness
- Optimize conversion elements
- Update biannually
Tier 3: Supporting content (50-60% of content)
- Moderate traffic, some conversion
- Fill out topic clusters
- Maintain for completeness
- Update annually or as needed
Tier 4: Underperformers (20-30% of content)
- Low traffic, minimal conversion
- Candidates for improvement or pruning
- Decide: optimize, redirect, or delete
Pro Tip: Create a “content audit scorecard” tracking: Organic traffic (40 points), Conversions (30 points), Backlinks (20 points), Freshness (10 points). This quantifies which content deserves optimization investment.
How Often Should You Review SEO Metrics?
Different metrics need different review cadences for SEO reporting for SaaS.
Weekly SEO Metrics Review
What to check weekly:
- Total organic traffic trend
- New trial signups from organic
- Critical keyword ranking changes
- Technical errors in Search Console
- Conversion rate anomalies
Why weekly: Spot issues quickly, maintain awareness, adjust tactics.
Time investment: 30-60 minutes
Monthly SEO Metrics Deep Dive
What to analyze monthly:
- Organic channel revenue attribution
- Content performance by tier
- Keyword ranking progress for targets
- Backlink acquisition rate
- Competitor positioning changes
- Conversion rate trends by page type
Why monthly: Enough data for meaningful insights, early enough to course-correct.
Time investment: 2-4 hours
Deliverable: Create monthly report for stakeholders covering:
- Revenue and pipeline contribution
- Key wins and challenges
- Action items for next month
- Progress toward quarterly goals
Quarterly SEO Strategic Review
What to evaluate quarterly:
- Overall SEO program ROI
- Progress toward annual goals
- Strategic initiative results
- Competitive landscape shifts
- Resource allocation effectiveness
- Budget planning for next quarter
Why quarterly: Long enough to see strategy impact, natural planning cycle alignment.
Time investment: Full day workshop
Deliverable: Quarterly board-ready presentation showing:
- Business impact metrics (revenue, CAC, LTV)
- Strategic wins and learnings
- Plan for next quarter
- Resource needs
Pro Tip: Use the same metrics dashboard for all review levels. Weekly = quick glance at dashboard. Monthly = detailed analysis of same dashboard. Quarterly = strategic implications of dashboard trends. Consistency makes trends obvious.
What Are Red Flag Metrics That Indicate SEO Problems?
Learn to spot SaaS conversion tracking warning signs early.
Critical Warning Signs
Organic traffic declining consistently:
- Problem: Algorithm update, technical issues, or competitor gains
- Action: Run technical audit, check Search Console for issues, analyze lost rankings
Conversion rate dropping significantly:
- Problem: Page changes, audience mismatch, or technical issues
- Action: Review page changes, check mobile experience, analyze user recordings
Ranking declines for money keywords:
- Problem: Competitor content, algorithm shift, or technical issues
- Action: Analyze top-ranking content, refresh your content, strengthen backlinks
Increasing bounce rate on key pages:
- Problem: Page speed issues, content mismatch, or poor UX
- Action: Check Core Web Vitals, verify search intent match, test mobile experience
Indexation drops in Search Console:
- Problem: Technical SEO issues, crawl errors, or penalty
- Action: Review Coverage report, check robots.txt, verify sitemap
Backlink profile declining:
- Problem: Lost links, toxic links, or competitor gains
- Action: Identify lost links, reach out to reclaim, increase link building
CAC from organic increasing:
- Problem: Traffic quality declining, conversion optimization needed
- Action: Refocus on high-intent keywords, improve conversion funnels
Pro Tip: Set up automated alerts in Google Analytics and Search Console for significant changes. Get notified immediately when traffic drops 20%+, conversion rate drops 30%+, or major ranking keywords fall out of top 10.
How Do You Report SEO Metrics to Non-Technical Stakeholders?
Executives don’t care about keyword difficulty scores. Here’s what SEO metrics matter for SaaS companies when presenting to leadership.
The Executive SEO Dashboard (One Page)
Top Section: Business Impact (50% of page real estate)
- Revenue attributed to organic this month/quarter
- Cost per acquisition from organic vs paid channels
- Organic’s share of new customer acquisition
- Month-over-month and year-over-year growth
Middle Section: Pipeline Metrics (30% of page)
- MQLs from organic
- Trial signups from organic
- Organic traffic to high-intent pages
- Conversion rate trends
Bottom Section: Health Indicators (20% of page)
- Visibility trend (overall ranking position changes)
- Traffic trend (qualified organic traffic)
- Key initiative status (major projects in progress)
Visual best practices:
- Use charts and graphs, not tables of numbers
- Show trends over time, not just current snapshot
- Compare to goals and previous periods
- Use green/yellow/red indicators for at-a-glance status
What Language to Use in SEO Reporting
Instead of: “We’re ranking for 1,247 keywords” Say this: “Organic search drove 487 qualified trials this quarter, 34% above target
Instead of: “Our domain authority increased from 45 to 52” Say this: “Our organic customer acquisition cost decreased 28% as our content gains authority”
Instead of: “We published 47 blog posts” Say this: “Our new content generated 289 MQLs and \$1.2M in attributed pipeline
Instead of: “Page speed improved to 2.3 second load time” Say this: “Site speed improvements increased mobile conversion rate by 15%
Pro Tip: Always lead with business impact, then support with technical details if asked. Start every SEO report with “Organic search contributed \$X in revenue this period, representing Y% of new customer acquisition at Z% lower cost than paid channels.
Understanding SaaS SEO strategy helps you align metrics with business objectives.
Real-World Example: SaaS SEO Metrics Dashboard
Let me show you what a complete metrics dashboard looks like.
Example: Marketing Automation SaaS
Company context:
- $50M ARR
- B2B marketing software
- Average contract value: $12,000
- 18-month sales cycle average
Monthly SEO Metrics Dashboard:
Business Impact:
- Organic-sourced revenue: $487,000 (12% of total)
- New customers from organic: 41
- Organic CAC: $2,341 (vs $4,892 blended)
- LTV:CAC ratio: 5.1:1 (healthy)
Pipeline Metrics:
- MQLs from organic: 247
- SQL conversion rate: 23%
- Trials from organic: 189
- Trial-to-paid: 22%
Traffic & Engagement:
- Qualified organic traffic: 47,329 sessions
- Traffic to decision pages: 12,847 (27%)
- Average pages per session: 3.2
- Organic conversion rate: 2.1%
Performance Indicators:
- Keywords in top 3: 432 (↑12 from last month)
- Backlinks earned: 67 (↑9 from last month)
- Content published: 14 pieces
- Technical health score: 94/100
Top Performing Content:
- “[Competitor] Alternatives” – 47 trials generated
- “Marketing Automation Guide” – 89 MQLs generated
- “[Brand] vs [Competitor]” – 31 trials generated
This dashboard tells a complete story from traffic through revenue.
Common Questions About SaaS SEO Metrics
What’s a good organic conversion rate for SaaS?
Depends on page type and traffic quality. Overall site: 2-4% is good. Pricing pages: 3-7%. Comparison pages: 5-10%. Blog posts: 0.5-2%. Track by page type and improve systematically rather than having blanket expectations.
How do we attribute revenue when customers touch multiple channels?
Use time-decay attribution giving more credit to recent touches, or position-based giving 40% each to first and last touch. Report first-touch separately to show organic’s awareness contribution. Most importantly, be consistent in your methodology.
Should we track mobile vs desktop metrics separately?
Yes, especially if conversion rates differ significantly. Most B2B SaaS sees research on mobile, conversion on desktop. Track: Mobile traffic %, Mobile conversion rate, Cross-device behavior. Optimize each experience separately.
How long should we wait to judge SEO ROI?
Minimum 6-12 months for meaningful results. SEO compounds—month 12 results reflect all prior work. Track leading indicators (rankings, traffic) monthly, but judge ROI on 12+ month horizons. Set realistic executive expectations upfront.
What if our SEO metrics look great but sales says leads are low quality?
You have a targeting problem, not a metrics problem. Review: Are you ranking for keywords your ICP searches? Is content qualifying visitors effectively? Are you capturing wrong audience? Work with sales to define lead quality criteria, then adjust strategy.
How do we measure SEO’s impact on brand awareness?
Track: Branded search volume growth, Direct traffic increase (often influenced by SEO), Share of voice in your category, Survey-based brand awareness metrics. SEO drives awareness even when conversion attribution is unclear.
What’s the minimum viable metrics stack for an early-stage SaaS?
Start with free tools: Google Analytics 4, Google Search Console, and your CRM integration. Track: Total organic traffic, Trial signups from organic, Revenue from organic customers. Add Ahrefs or SEMrush when you have $100-200/mo budget. Build sophistication as you scale.
Your SEO Metrics Action Plan
Ready to implement proper SEO KPIs for SaaS? Here’s your roadmap.
Week 1: Foundation Setup
- Audit current analytics setup
- Implement proper UTM tracking
- Connect GA4 to CRM
- Set up conversion tracking for all key actions
- Create basic traffic dashboard
Week 2: Attribution Framework
- Define attribution model(s) to use
- Set up multi-touch tracking (if available)
- Document what gets credit and how
- Train team on reading attribution reports
Week 3: Dashboard Creation
- Build executive one-pager
- Create detailed marketing dashboard
- Develop SEO team working dashboard
- Set up automated reporting (weekly/monthly)
Week 4: Process Implementation
- Schedule weekly metrics reviews
- Plan monthly deep-dive format
- Set quarterly strategic review dates
- Document escalation triggers for issues
Month 2+: Optimization
- Refine dashboards based on usage
- Add missing metrics as needs emerge
- Improve data accuracy and completeness
- Train stakeholders on interpreting metrics
Pro Tip: Start simple and add complexity as needed. A basic dashboard you actually use beats a sophisticated one you ignore. Begin with traffic, conversions, and revenue. Layer on attribution, content performance, and competitive metrics later.
Final Thoughts: Metrics That Drive Decisions
SaaS SEO metrics should inform decisions, not just fill reports.
Every metric you track should answer a question:
- “Are we targeting the right keywords?” → Track qualified traffic and conversion rates
- “Is our content working?” → Track content-level conversions and revenue
- “Should we invest more in SEO?” → Track ROI and CAC compared to other channels
- What should we optimize next?” → Track performance by page type and opportunity size
The best metrics systems are simple, consistent, and action-oriented. You don’t need to track everything—you need to track the things that change your strategy.
Most importantly, connect SEO metrics to business outcomes. Traffic is a means to an end. Rankings are a means to an end. The end is revenue, customers, and profitable growth.
Executives who understand SEO’s revenue contribution protect and increase SEO budgets. Those who only see traffic numbers question SEO’s value constantly.
Track what matters. Report what resonates. Optimize what works. That’s how SEO becomes your most predictable revenue channel.
Now stop reading and start measuring. Your budget depends on it.
🎯 SaaS SEO Metrics Dashboard
Interactive Tracking & ROI Calculator for B2B Software Companies
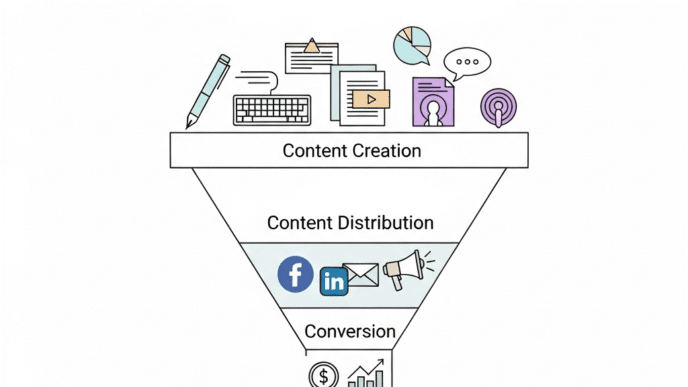
📈 SEO Conversion Funnel
📊 Content Performance by Type
Monthly conversions generated by content type
🎯 Attribution Model Comparison
📋 SEO Health Indicators
| Metric | Current | Target | Status |
|---|---|---|---|
| Keywords in Top 3 | 432 | 400+ | Excellent |
| Domain Rating | 67 | 60+ | Strong |
| Backlinks (Monthly) | 67 | 50+ | Growing |
| Pages Indexed | 94% | 90%+ | Healthy |
| Core Web Vitals (LCP) | 2.1s | <2.5s | Good |
| Mobile Conversion Rate | 1.8% | 2.0%+ | Needs Improvement |
| Technical Health Score | 94/100 | 90+ | Excellent |
| Content Freshness | 87% | 85%+ | Current |