You’re investing time and money into local SEO, but here’s the million-dollar question: Is it actually working?
Most business owners are flying blind. They know their phone rings more often, but they can’t tell if it’s from their Google Business Profile optimization, those location pages they created, or just good old-fashioned word-of-mouth.
Without proper local SEO analytics, you’re basically throwing spaghetti at the wall and hoping something sticks. And let’s be honest—that’s not a strategy, that’s a gamble.
Here’s what you need to know: tracking local SEO isn’t like tracking regular SEO. Rankings change by neighborhood. Customer behavior varies by location. And the metrics that matter for a local pizza shop are completely different from what matters for an e-commerce giant.
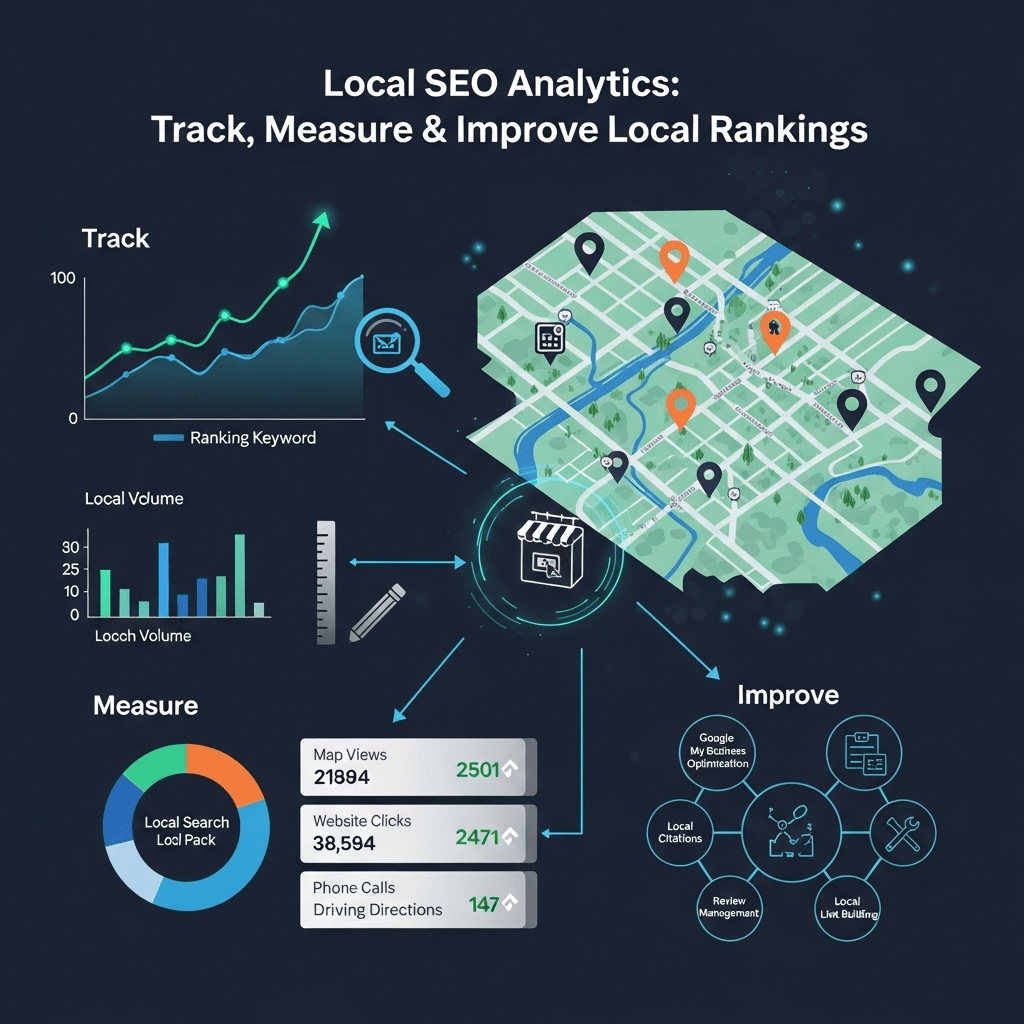
This guide will show you exactly how to track, measure, and improve your local search performance using data that actually matters—not vanity metrics that look pretty in reports but don’t pay the bills.
Table of Contents
ToggleWhy Local SEO Analytics Is Different (And Why You Can’t Skip It)
Traditional SEO analytics tells you how your website performs globally or nationally. Local SEO analytics tells you how you’re performing in your specific service areas—and that’s a completely different animal.
Here’s the deal: you could rank #1 nationally for “best pizza” but rank nowhere for “pizza delivery near me” in your actual city. Which ranking pays your rent?
The Unique Challenges of Measuring Local Search Performance
Challenge #1: Rankings vary by location
Search for “plumber” from Denver, and you’ll see completely different results than someone searching from Seattle. Even within the same city, results change by neighborhood.
This means you can’t just check your rankings once and call it a day. You need location-specific tracking.
Challenge #2: Multiple data sources matter
Local SEO success isn’t just about your website. You need data from:
- Google Business Profile
- Your website analytics
- Call tracking systems
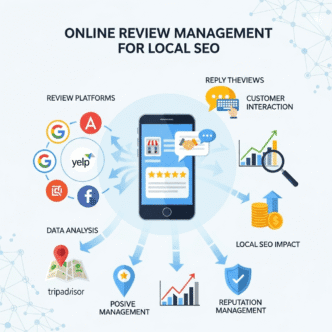
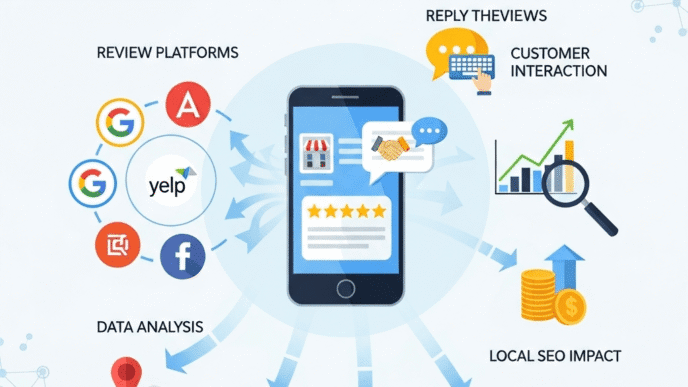
- Review platforms
- Citation directories
- Social media (yes, it matters locally)
Ignoring any of these creates blind spots in your strategy.
Challenge #3: Local conversions happen offline
Someone might search on their phone, call your business, and show up in person. How do you track that customer journey? Without proper local SEO metrics setup, you don’t.
Challenge #4: Attribution is messy
Did that customer find you through Google Maps, an organic search result, or a review site? Understanding the customer journey helps you double down on what works.
What Happens When You Don’t Track Local SEO
- You waste money on strategies that don’t work
- You can’t prove ROI to stakeholders or clients
- You miss opportunities in high-performing locations
- You don’t notice when rankings drop until it’s too late
- You can’t identify which marketing channels drive actual customers
Pro Tip: Don’t try to track everything at once. Start with 5-7 key metrics that directly impact your bottom line, then expand as you get more sophisticated.
The Essential Local SEO Metrics You Must Track in 2025
Let’s cut through the noise. These are the local SEO KPIs that actually matter.
1. Google Business Profile (GBP) Metrics
Your GBP is often the first thing potential customers see. These metrics tell you how it’s performing.
Search Queries
- How many people searched and found your GBP
- What search terms they used
- Whether they searched directly for your business or discovered you
Direct searches (“Joe’s Pizza”) mean people already know you. Discovery searches (“pizza near me”) mean you’re attracting new customers.
Views
- Profile views: How many people saw your GBP listing
- Search views: How many times you appeared in search results
- Maps views: How many times you appeared on Google Maps
If views are high but actions are low, your profile needs optimization (better photos, updated info, compelling description).
Actions
- Website clicks
- Phone calls
- Direction requests
- Messaging inquiries
These are the money metrics. Someone requesting directions is probably coming to your business. A phone call might convert to a sale.
Photo Views and Quantity
Businesses with photos receive 42% more direction requests and 35% more website clicks than those without, according to Google.
Track which photos get the most views—these are what resonates with your audience.
Pro Tip: Check your GBP Insights weekly, not monthly. Local search patterns can change quickly, and weekly monitoring helps you catch trends or problems faster.
2. Local Pack Rankings
The “local pack” is those three businesses that appear in Google Maps results. Ranking here is gold.
Why local pack rankings matter:
- They appear above organic results
- They include visual elements (photos, ratings)
- They often capture high-intent searches
- Click-through rates are significantly higher
How to track local rankings:
You can’t just Google yourself—your location, search history, and device affect results. You need tools that check rankings from specific locations.
Use tracking local rankings tools like:
- Local Falcon (shows rankings on a map grid)
- BrightLocal (tracks rankings across multiple locations)
- GMB Crush (Google Business Profile specific)
- SEMrush (includes local rank tracking)
Pro Tip: Track rankings for both your exact business name AND category searches (“coffee shop near me,” “emergency plumber,” etc.). Discovery searches matter more for growth.
3. Organic Website Traffic from Local Search
Not everyone clicks on your GBP—some click through to your website first.
Key segments to track in Google Analytics 4:
Traffic by city/region
- Which service areas send the most traffic
- Which locations have high bounce rates (might need better location pages)
Traffic by landing page
- Are your location pages working?
- Which service pages attract the most local visitors?
Mobile vs. desktop traffic
Local searches are heavily mobile (around 76% according to Think with Google). If your mobile traffic is low, you might have a mobile usability problem.
Organic search traffic trends
Growing? Good. Plateauing? Time to refresh your content strategy. Declining? You might have a technical issue or lost rankings.
4. Conversion Metrics That Actually Matter
Traffic is nice. Revenue is better.
Phone calls from search
Use call tracking numbers on your website and GBP to attribute calls to specific sources. Services like CallRail or CallTrackingMetrics integrate with analytics.
Form submissions
Track quote requests, appointment bookings, and contact forms. Segment by traffic source to see what drives conversions.
Direction requests
Someone asking for directions is highly likely to visit. If you’re a physical location business, this metric directly correlates with foot traffic.
“Near me” keyword conversions
People searching “plumber near me” are ready to hire TODAY. Track how many of these high-intent searches convert to calls or form fills.
5. Review Metrics
Reviews are ranking factors AND conversion factors. You need to track both quantity and quality.
Review volume by platform:
- Google (most important)
- Industry-specific sites (Yelp, Angie’s List, etc.)
Average rating trends
Is your average rating improving or declining? Track it monthly.
Review velocity
How many reviews do you get per month? Consistent review generation signals to Google that you’re an active, legitimate business.
Review response rate
Do you respond to reviews? This affects both rankings and customer perception. Aim for 100% response rate.
Review sentiment by location
If you serve multiple locations, are some areas happier than others? This identifies operational issues or opportunities.
6. Citation Consistency and NAP Score
Citations are mentions of your Name, Address, and Phone (NAP) across the web.
What to track:
- Total citation count
- Consistency score (what percentage have correct info)
- High-authority citations (BBB, Yelp, industry directories)
- Duplicate listings (these hurt you)
Tools like Moz Local, BrightLocal, or Whitespark can audit your citations and give you a consistency score.
Pro Tip: Aim for 95%+ consistency. Even small variations (“Street” vs. “St.”) can confuse Google and weaken your local signals.
7. Click-Through Rate (CTR) from Local Search
You can rank #1 and still lose if no one clicks.
What affects local CTR:
- Star rating (4.5+ stars gets more clicks)
- Photo quality and quantity
- Business description
- Review recency
Track your CTR in Google Search Console and compare it to industry benchmarks. Low CTR despite good rankings means your listing needs optimization.
Comparison: Which Metrics Matter Most by Business Type
| Business Type | Top 3 Priority Metrics | Why They Matter |
|---|---|---|
| Restaurants/Retail | Direction requests, Photo views, Review count | Physical visits drive revenue |
| Service Area Businesses | Phone calls, Service area traffic, Multi-location reviews | Customers need immediate help |
| Professional Services | Website clicks, Form submissions, Branded searches | Research-driven decisions |
| Emergency Services | Phone calls, “Near me” rankings, Mobile traffic | High-intent, time-sensitive |
The bottom line: Focus on metrics that connect directly to how customers actually find and choose your business.
How to Set Up Google Business Profile Analytics Tracking
Your Google Business Profile analytics guide starts here. GBP Insights is free, powerful, and often underutilized.
Step 1: Access Your GBP Insights
- Log into Google Business Profile Manager
- Select your business location
- Click “Performance” in the left sidebar
- Choose your date range (last 7 days, 30 days, 90 days, or custom)
Step 2: Understand the Four Main Insight Categories
How customers search for your business:
- Direct: Searched your business name specifically
- Discovery: Found you while searching for a category or product
- Branded: Clicked through from another Google service
Direct searches are great, but discovery searches grow your business. If 90% of searches are direct, you’re not attracting new customers.
Where customers view your business on Google:
- Listing on Maps
- Listing on Search
Both matter, but Maps typically indicates higher intent (they’re already looking at a map to visit).
Customer actions:
- Website visits
- Phone calls
- Direction requests
- Message inquiries
These are your conversion metrics. If actions are low relative to views, your listing needs optimization.
Direction requests breakdown:
Shows where people are requesting directions FROM. This reveals your actual customer base geography, which might differ from where you THINK your customers are.
Step 3: Set Up Tracking for Deeper Insights
GBP Insights is great, but it has limitations. Enhance it with:
Call tracking integration:
Add a unique tracking number to your GBP listing. This lets you:
- Record calls for quality assurance
- Attribute calls to GBP specifically
- Track which calls convert to customers
UTM parameters on your GBP website link:
Add UTM parameters to track GBP traffic separately in Google Analytics: ?utm_source=google&utm_medium=organic&utm_campaign=gbp
This isolates GBP traffic from other Google traffic in your analytics.
Google Ads integration (if applicable):
Link your GBP to Google Ads to see how local services ads perform alongside your organic presence.
Step 4: Create a Monitoring Schedule
Weekly checks:
- Overall views and actions trends
- New reviews and your response status
- Top search queries
- Competitor comparison (if available in your area)
Monthly deep dives:
- Month-over-month growth
- Seasonal trend identification
- Photo performance analysis
- Action rate optimization opportunities
Pro Tip: Export your GBP data monthly and keep it in a spreadsheet. Google only shows limited historical data, but you’ll want year-over-year comparisons eventually.
Setting Up Your Local SEO Reporting Dashboard
Raw data is overwhelming. A local SEO reporting dashboard setup makes it actionable.
What Makes a Great Local SEO Dashboard
Clarity: One glance should tell you if things are good, bad, or need attention
Relevance: Only include metrics that impact your business goals
Actionability: Data should suggest clear next steps
Accessibility: Stakeholders should understand it without a PhD in analytics
Essential Components of Your Dashboard
Section 1: Overview Snapshot
- Total local search impressions (month)
- Total actions taken (calls, directions, clicks)
- Conversion rate (actions ÷ impressions)
- Month-over-month growth percentage
Section 2: Rankings
- Local pack rankings for top 5 keywords
- Organic rankings for location + service combinations
- Ranking changes (up/down arrows)
- Competitor comparison
Section 3: Traffic & Engagement
- Local organic sessions
- Pages per session
- Average session duration
- Bounce rate
Section 4: Conversions
- Phone calls from organic search
- Form submissions from local traffic
- Direction requests
- Estimated revenue from local search
Section 5: Reputation
- Current average rating
- New reviews this month
- Review response rate
- Sentiment trends
Section 6: Competitive Analysis
- Your review count vs. top 3 competitors
- Your average rating vs. competitors
- Share of local pack appearances
- Category ranking position
Dashboard Tools Comparison
| Tool | Best For | Price | Key Features |
|---|---|---|---|
| Google Looker Studio (Data Studio) | Custom dashboards | Free | Integrates all Google tools |
| BrightLocal | Local SEO agencies | $39-$249/mo | Multi-location tracking |
| SEMrush | Comprehensive SEO | $130-$500/mo | Includes rank tracking |
| AgencyAnalytics | Client reporting | $12-$79/mo per client | White-label reports |
| Local Falcon | Visual rank tracking | $30-$105/mo | Map-based rankings |
| Whitespark | Local citation tracking | $35-$300/mo | Citation management |
Pro Tip: Start with Google Looker Studio (formerly Data Studio)—it’s free and integrates seamlessly with Google Analytics, Search Console, and Google Sheets where you can import other data sources.
Building Your First Dashboard in Google Looker Studio
Step 1: Connect your data sources
- Google Analytics 4
- Google Search Console
- Google Sheets (for manual data like GBP insights, call tracking, reviews)
Step 2: Create key metric cards
At the top of your dashboard, add scorecard visualizations showing:
- Total local sessions (this month)
- Total phone calls
- Total direction requests
- Average GBP rating
Use comparison dates to show month-over-month change.
Step 3: Add trend charts
Line charts showing:
- Local organic traffic over time
- GBP views over time
- Phone calls over time
- Rankings over time (from manual Google Sheets input)
Step 4: Add segment breakdowns
Tables or bar charts showing:
- Traffic by city
- Traffic by landing page
- Top converting keywords
- Device breakdown (mobile vs. desktop)
Step 5: Add geographical heat maps
If you serve multiple locations, create a map showing traffic or conversions by region.
Step 6: Schedule automated reports
Set up email delivery of your dashboard weekly or monthly so stakeholders get updates automatically.
For a comprehensive foundation on the strategies these analytics measure, check out this complete guide to local SEO.
Best Local SEO Analytics Tools for 2025
Let’s break down the best local SEO analytics tools and when to use each.
All-in-One Platforms
1. BrightLocal
Best for: Agencies and businesses managing multiple locations
Key features:
- Local rank tracking across multiple locations
- Citation building and monitoring
- Review monitoring across 70+ platforms
- Automated reporting
- Reputation management tools
Pricing: $39-$249/month
Pros: Comprehensive, great for agencies, white-label reporting Cons: Can be pricey for single-location businesses
2. SEMrush
Best for: Businesses wanting local + broader SEO capabilities
Key features:
- Position tracking with local pack monitoring
- Competitive analysis
- Keyword research
- Listing management
- Traffic analytics
Pricing: $130-$500/month
Pros: Powerful all-around SEO suite Cons: Overwhelming for beginners, expensive
3. Moz Local
Best for: Businesses focused on citation management
Key features:
- Citation distribution to 15+ aggregators
- Listing sync and management
- Duplicate listing detection
- Visibility scoring
Pricing: $99-$249/year per location
Pros: Strong citation network, good for cleaning up inconsistent listings Cons: Limited rank tracking features
Specialized Tools
4. Local Falcon
Best for: Visual local rank tracking
Key features:
- Map-based rank checking from specific coordinates
- Grid-based proximity heat maps
- Competitor tracking
- Rank scanning at scale
Pricing: $30-$105/month
Pros: Visual representation makes patterns obvious Cons: Focused solely on rankings, not other metrics
Why it’s special: Shows exactly where your business appears in local pack from different locations in your city. You might rank #1 from downtown but #8 from the suburbs—Local Falcon shows you this visually.
5. GatherUp (formerly GetFiveStars)
Best for: Review management and monitoring
Key features:
- Multi-platform review monitoring
- Review generation campaigns
- Sentiment analysis
- Competitive review benchmarking
Pricing: $99-$299/month
Pros: Excellent review features, good customer support Cons: Not comprehensive for other local SEO metrics
6. CallRail
Best for: Call tracking and attribution
Key features:
- Dynamic number insertion
- Call recording
- Source attribution
- Form tracking
- Keyword-level call tracking
Pricing: $45-$145/month
Pros: Robust call tracking, integrates with CRMs Cons: Costs add up with multiple tracking numbers
Free Tools You Shouldn’t Ignore
Google Business Profile Insights
- Free performance data
- Customer actions tracking
- Search query visibility
Google Analytics 4
- Website traffic analysis
- Conversion tracking
- Geographic performance
Google Search Console
- Keyword rankings
- Click-through rates
- Technical SEO issues
Google Looker Studio
- Custom dashboard creation
- Automated reporting
- Data source integration
Pro Tip: Start with free tools, then add paid tools as specific needs arise. Many businesses waste money on expensive tools they barely use.
How to Track Local SEO Rankings Accurately
Here’s the problem with tracking local rankings: they’re fluid, personalized, and location-dependent.
Someone searching “coffee shop” from Main Street sees different results than someone searching from 5th Avenue in the same city. Your rankings aren’t one number—they’re dozens of numbers depending on where the searcher is.
Why You Can’t Just Google Yourself
When you search for your business keywords, Google serves personalized results based on:
- Your search history
- Your physical location
- Your device
- Whether you’re logged into Google
- Your past interactions with businesses
This means your “rankings” might look amazing to you but terrible to actual customers.
The Right Way to Track Local Rankings
Method 1: Use incognito/private browsing with VPN
This removes personalization, but it’s time-consuming and still imperfect. Better for quick spot checks than systematic tracking.
Method 2: Use rank tracking tools with location targeting
Tools like BrightLocal, Local Falcon, or SEMrush let you:
- Specify exact coordinates for rank checks
- Track rankings from multiple locations simultaneously
- See historical rank data
- Compare your rankings to competitors
Method 3: Grid-based tracking for geographic coverage
Local Falcon excels here. It checks rankings from a grid of coordinates across your service area, showing you a heat map of where you rank well and where you don’t.
Example: A Denver restaurant might rank #1 in downtown but #12 in suburban areas. Grid tracking reveals these patterns.
What to Track
Local pack rankings (top 3 Google Maps results):
- Your primary keyword (“pizza Denver”)
- Your service + location combinations (“emergency plumber Denver”)
- “Near me” variations when checked from different locations
Organic local rankings (below the map pack):
- Same keywords as above
- Long-tail service + location combinations
- Question-based queries (“where to get pizza in Denver”)
Google Maps app rankings:
Separate from the local pack shown in regular Google Search. Some tools track this separately.
Tracking Frequency
Daily: Not necessary and often misleading due to normal fluctuation
Weekly: Good for active campaigns or new businesses
Monthly: Perfect for established businesses in stable markets
Pro Tip: Don’t panic over small ranking fluctuations. Look at trends over weeks and months, not day-to-day changes.
Creating Actionable Local SEO Reports (That Actually Get Read)
You’ve got the data. Now make it matter.
Most measuring local SEO success reports fail because they dump data without context or action items. Here’s how to create reports that drive decisions.
The Perfect Local SEO Report Structure
Executive Summary (1 page max)
- Key wins this month
- Critical issues identified
- Top 3 recommended actions
- Month-over-month performance snapshot
This is all busy stakeholders need to read. Everything else is supporting detail.
Performance Highlights
- GBP views and actions trend
- Traffic from local search
- Phone calls and conversions
- Ranking improvements
Use visuals—charts, graphs, before/after screenshots. Most people skim, and visuals communicate faster than paragraphs.
Competitive Analysis
- Your ranking vs. top 3 competitors
- Your review count and rating vs. competitors
- Share of voice in local pack
Showing where you stand relative to competitors provides context for your performance.
Detailed Metrics
- Traffic by location/service area
- Top performing location pages
- Review summary (new reviews, responses, sentiment)
- Citation status
This section is for people who want to dig deeper.
Recommendations & Next Steps
- Specific, actionable recommendations based on data
- Prioritized (high/medium/low impact)
- Resource requirements
- Expected outcomes
This is the most valuable section—it answers “so what do we do now?”
Pro Tip: Lead with wins, even small ones. Positive momentum makes stakeholders more receptive to recommendations and continued investment.
Report Frequency by Business Type
Monthly reports: Most businesses
Provides enough data to identify trends without overwhelming with too-frequent updates.
Quarterly reports: Small businesses with stable local presence
Less frequent but more strategic, focusing on longer-term trends.
Weekly snapshots: Businesses running active campaigns
Quick updates on key metrics during periods of heavy optimization or competitive pressure.
Real-World Example: Restaurant Local SEO Report That Drove Action
Business: Mama Rosa’s Italian Restaurant (Phoenix, AZ)
Report highlight from May 2024:
Executive Summary:
- GBP views increased 34% (4,200 → 5,628)
- Direction requests up 41% (180 → 254)
- But: Phone calls decreased 12% (95 → 84)
- New reviews: 8 (maintaining 4.7 average)
Key finding: Phone number on GBP was different from website and Google was displaying the wrong one.
Action taken: Fixed phone number consistency across all platforms.
Result: Calls recovered to 102 the following month (+21% from low point).
The lesson: Even great performance metrics can hide critical issues. Always look for anomalies that don’t match overall trends.
Advanced Local SEO Analytics: AI and Predictive Insights for 2025
Welcome to the future. Local search analytics is getting smarter, and you should too.
AI-Powered Trend Detection
Modern analytics platforms are incorporating AI to:
Identify ranking patterns humans might miss
AI can spot that you rank better on rainy days (people searching “food delivery”) or that certain neighborhoods convert better at specific times.
Predict seasonal trends
Based on historical data, AI predicts when you’ll need to ramp up local SEO efforts (summer for HVAC, winter for heating services, etc.).
Anomaly detection
AI alerts you when metrics deviate significantly from patterns—catching problems faster than manual monitoring.
Tools incorporating AI analytics:
- SEMrush (Position Tracking with anomaly detection)
- Google Analytics 4 (predictive metrics like purchase probability)
- BrightLocal (trend analysis)
Voice Search Analytics
Voice searches are increasingly local (“Hey Siri, find a coffee shop near me”). Track:
Question-based keyword performance
Voice queries are conversational: “where can I get my car fixed near me” vs. typing “auto repair near me.”
Use Search Console and keyword tools to identify question phrases driving traffic.
Featured snippet appearances
Voice assistants often pull from featured snippets. Track whether your content appears in position zero for local queries.
“Near me” query performance
These increased 900% in recent years according to Google Trends. Track your ranking and traffic from these high-intent phrases.
Predictive Analytics for Local SEO ROI
The future of measuring local search performance is predictive, not just reactive.
Customer Lifetime Value (CLV) by channel
Track not just which channel brought the customer, but their total value over time. Maybe GBP customers have lower initial transaction value but higher retention.
Forecasting based on ranking changes
If you move from position #5 to #3 in the local pack, historical data can predict the traffic and revenue impact.
Budget optimization
AI helps allocate budget between local SEO, paid ads, and other channels based on predicted ROI.
Pro Tip: While AI is powerful, don’t let it replace human judgment. Use AI insights to spot opportunities and problems, but apply context and strategy based on your business knowledge.
Privacy-First Analytics in 2025
Google Analytics 4 was built for a privacy-first world. As third-party cookies disappear:
Server-side tracking is becoming standard for accurate attribution
First-party data (your own customer data) becomes more valuable than ever
Consent management affects what you can track—make sure your analytics setup complies with regulations
For local businesses, this actually creates an advantage: you have direct customer relationships and can build first-party data more easily than national brands.
Common Local SEO Analytics Mistakes (And How to Avoid Them)
Let’s talk about what NOT to do.
Mistake #1: Tracking Vanity Metrics Instead of Business Metrics
The trap: Celebrating increases in impressions or rankings without connecting to revenue.
The fix: Always ask “how does this metric impact our bottom line?” If you can’t answer, it might be a vanity metric.
Example: A restaurant celebrated ranking #1 for “Italian food” citywide. But their actual customers searched “Italian restaurant [neighborhood name].” They were optimizing for the wrong keywords.
Mistake #2: Not Segmenting Data by Location
The trap: Looking at aggregate data across all service areas instead of location-specific performance.
The fix: Always segment by city/region. You might be crushing it in one area while underperforming in another—aggregate data hides this.
Mistake #3: Ignoring Mobile Analytics
The trap: Focusing on desktop metrics when 76% of local searches happen on mobile.
The fix: Always view mobile performance separately. Check mobile page speed, mobile rankings, and mobile user behavior specifically.
Mistake #4: Not Connecting Online Metrics to Offline Conversions
The trap: Only tracking website conversions while ignoring that most local business happens via phone calls or in-person visits.
The fix: Implement call tracking, ask customers how they found you, use unique offers per channel to track offline attribution.
Mistake #5: Comparing Yourself to Irrelevant Competitors
The trap: Benchmarking against huge national chains when you’re a local business, or vice versa.
The fix: Identify 3-5 true competitors—businesses of similar size in your exact market—and track metrics against them.
Mistake #6: Analysis Paralysis
The trap: Getting so deep into data that you never actually take action.
The fix: Set a decision-making framework. Every metric you track should lead to potential actions. If reviewing a metric doesn’t suggest any possible action, stop tracking it.
Pro Tip: Spend 20% of your time analyzing and 80% of your time acting on insights. Too many businesses invert this ratio.
Local SEO Analytics Action Plan: Your 30-Day Setup Guide
Ready to implement? Here’s your step-by-step plan for measuring local SEO success.
Week 1: Foundation Setup
Day 1-2: Google Business Profile audit
- Claim/verify your GBP if not done
- Complete all profile sections 100%
- Add photos (minimum 10 high-quality images)
- Enable messaging
- Document your baseline metrics
Day 3-4: Google Analytics 4 configuration
- Install GA4 if not already set up
- Set up conversion tracking (form submissions, phone clicks)
- Create custom segments for local traffic
- Enable enhanced measurement
Day 5-6: Google Search Console setup
- Verify your website in Search Console
- Submit sitemap
- Note baseline organic impressions and clicks
- Identify any critical errors to fix
Day 7: Tool evaluation
- Based on your budget and needs, choose 1-2 tools from the comparison table above
- Sign up for free trials
- Begin connecting data sources
Week 2: Data Collection
Day 8-9: Set up rank tracking
- Identify your top 10 target keywords
- Configure rank tracking for your primary service locations
- Set up competitor tracking (3-5 competitors)
Day 10-11: Call tracking implementation
- Choose a call tracking service
- Add tracking numbers to website and GBP
- Set up call recording (if needed)
Day 12-13: Citation audit
- Use a tool like Moz Local or BrightLocal to audit citations
- Document your NAP consistency score
- Identify duplicate or incorrect listings
Day 14: Review platform setup
- Identify which review platforms matter for your industry
- Set up monitoring for Google, Facebook, Yelp, industry-specific sites
- Document current review count and average ratings
Week 3: Dashboard Creation
Day 15-17: Build your first dashboard
- Use Google Looker Studio or your chosen tool
- Connect data sources
- Create sections: Overview, Rankings, Traffic, Conversions, Reputation
- Add at least one visualization per section
Day 18-19: Set up automated reports
- Configure weekly email snapshots
- Create monthly detailed reports
- Set up alerts for critical metrics (ranking drops, review volume drops)
Day 20-21: Team training
- Document what each metric means
- Train team members on how to access and read reports
- Assign responsibilities (who checks what, when)
Week 4: Analysis and Action
Day 22-24: Baseline analysis
- Review all metrics collected so far
- Identify top 3 strengths
- Identify top 3 opportunities for improvement
- Compare to competitors where possible
Day 25-26: Create action plan
- Based on data, prioritize 3-5 specific optimization tasks
- Assign owners and deadlines
- Set measurable goals (increase GBP actions 20%, improve CTR from X% to Y%)
Day 27-28: Implement quick wins
- Fix any issues discovered (wrong phone number, missing business hours, broken links)
- Respond to all unanswered reviews
- Add missing content where gaps identified
Day 29-30: Set up ongoing processes
- Schedule weekly/monthly review meetings
- Create a content calendar based on keyword opportunities
- Set up review generation campaigns
- Document your analytics workflow
Pro Tip: Don’t expect perfect results in 30 days. This setup phase establishes your baseline and systems. Real improvements become visible in months 2-6.
Integrating Local SEO Analytics with Your Overall Marketing Strategy
Your local SEO analytics shouldn’t exist in a vacuum. Connect it to everything else you’re doing.
Connecting Local SEO Data to Other Channels
Local SEO ↔ Paid Search:
- Use organic keyword data to inform Google Ads local campaigns
- Identify keywords where you rank poorly organically—consider bidding on them
- Use local SEO landing pages for ad campaigns (better Quality Scores)
Local SEO ↔ Social Media:
- Share positive reviews on social media
- Use GBP posts to amplify social media content
- Track social media referrals to location pages
Local SEO ↔ Email Marketing:
- Segment email lists by location
- Share local content based on recipient geography
- Track email as a re-engagement channel for past searchers
Local SEO ↔ Content Marketing:
- Use “Questions” data from GBP and Search Console to inform blog topics
- Repurpose high-performing blog content into GBP posts
- Create location-specific content based on high-traffic but low-conversion areas
Attribution Modeling for Local Businesses
The customer journey isn’t linear. Someone might:
- See your business on Google Maps
- Visit your website
- Read reviews on Yelp
- Call you directly the next day
Which channel gets credit? This is attribution.
First-touch attribution: Credits the first interaction (Google Maps view)
Last-touch attribution: Credits the final interaction (phone call)
Multi-touch attribution: Distributes credit across all touchpoints
For local businesses, multi-touch attribution is most accurate but requires more sophisticated tracking. Start simple (last-touch) and evolve as your analytics mature.
Creating a Unified Local Marketing Dashboard
Bring together:
- Local SEO metrics (rankings, GBP performance)
- Paid advertising (Google Local Services Ads, Google Ads)
- Review metrics (across all platforms)
- Social media (local engagement, foot traffic from social)
- Email marketing (location-based campaign performance)
- Offline attribution (how did you hear about ustracking)
This unified view reveals:
- Which channels work best together (maybe social media drives awareness but local SEO drives conversions)
- Where budget should be allocated
- How customers actually move through your funnel
Pro Tip: Use a tool like Google Looker Studio to pull data from multiple sources into one dashboard. Connect Google Ads, Analytics, Google Sheets (for manual data entry from GBP and other sources), and social media APIs.
For more on how these analytics support your overall local strategy, explore this comprehensive local SEO resource that covers the foundational tactics you’ll be measuring.
Case Study: How a Multi-Location Business Used Analytics to Triple Local Traffic
Let’s look at a real success story of tracking local SEO rankings and turning data into action.
Business: Bright Smile Dental (multi-location dental practice in Austin, TX)
Challenge:
- 5 locations across Austin
- Inconsistent performance across locations
- No systematic tracking in place
- Spending \$8K/month on Google Ads with unclear ROI
Analytics Implementation (Month 1-2):
Step 1: Set up comprehensive tracking
- Implemented BrightLocal for multi-location rank tracking
- Added unique call tracking numbers to each location’s GBP
- Created separate GA4 property views for each location
- Established baseline metrics
Baseline findings:
- Location #1 (Downtown): 450 monthly GBP views, 4.8 rating, 89 reviews
- Location #2 (South Austin): 180 monthly GBP views, 4.3 rating, 23 reviews
- Location #3 (North Austin): 320 monthly GBP views, 4.6 rating, 54 reviews
- Location #4 (West Austin): 95 monthly GBP views, 4.7 rating, 31 reviews
- Location #5 (East Austin): 210 monthly GBP views, 4.4 rating, 18 reviews
Key insights from analytics:Insight #1: Location #4 (West Austin) had the lowest visibility despite being in a high-income area with strong demand.
Action: Aggressive review generation campaign + content targeting “West Austin dentist” keywords
Insight #2: Location #2 had the lowest rating (4.3) and review velocity had declined.
Action: Operational improvements + staff training + review management system
Insight #3: 73% of phone calls came from mobile searches, but mobile page speed was terrible (5.2 seconds).
Action: Website speed optimization, especially for location landing pages
Insight #4: “Emergency dentist” searches drove 31% of calls but they only ranked top 3 for this term at 1 of 5 locations.
Action: Created emergency service content for each location page + same-day appointment booking feature
Results After 6 Months:Metric Before After Change Total GBP views (all locations) 1,255/month 3,840/month +206% Phone calls from organic search 87/month 286/month +229% Direction requests 145/month 394/month +172% Average rating (all locations) 4.54 4.68 +3% Total reviews 215 467 +117% Organic website sessions 2,100/month 6,600/month +214% Estimated monthly revenue from local SEO $42K $178K +324% The game-changer: They reduced Google Ads spend from $8K to $3K/month while increasing total leads, achieving an ROI of 1,900% on their local SEO investment.
Key takeaway: Without analytics, they were flying blind. Data revealed which locations needed attention and exactly what to fix. The result? Massive growth with lower overall marketing costs.
Troubleshooting: When Your Local SEO Analytics Doesn’t Make Sense
Sometimes the numbers lie. Well, not lie—but they tell confusing stories.
Problem #1: Rankings Look Great, But Traffic Is Low
Possible causes:
- You’re ranking for low-volume keywords
- Your listings have poor CTR (bad title, low rating, poor photos)
- You’re ranking outside your actual service area
- Rankings are from personalized searches, not real customer searches
How to investigate:
- Check Search Console for actual impressions vs. clicks
- Compare your tracking tool rankings with anonymized searches
- Review your GBP listing—is it compelling?
- Check if your target keywords have actual search volume
Fix: Optimize your GBP listing for CTR (better photos, compelling description, maintain high ratings) and research keywords with actual search demand.
Problem #2: High Traffic, But No Conversions
Possible causes:
- Wrong intent traffic (informational searchers, not customers)
- Poor website user experience
- Missing or unclear calls-to-action
- Broken contact forms or phone numbers
- Location mismatch (ranking in areas you don’t serve)
How to investigate:
- Review actual keywords driving traffic—are they commercial or informational?
- Test your website on mobile—does everything work?
- Check form submissions for error messages
- Call your own phone number from the site—does it work?
- Review heatmaps or session recordings to see where users get stuck
Fix: Improve UX, add clear CTAs, consider adding live chat for immediate assistance, ensure mobile optimization.
Problem #3: GBP Views Are High, But Actions Are Low
Possible causes:
- Your listing doesn’t inspire confidence (low rating, old photos, incomplete info)
- Business hours aren’t clear or are wrong
- Service area confusion (people aren’t sure if you serve them)
- Competitors have better listings
How to investigate:
- Compare your GBP to top competitors—what are they doing better?
- Check reviews—do they mention any confusion or concerns?
- Mystery shop yourself—search from different locations and see what you’d think as a customer
Fix: Complete every section of your GBP, add high-quality photos (updated regularly), maintain 4.5+ star rating, respond to all reviews, add GBP posts weekly.
Problem #4: Some Locations Perform Great, Others Struggle
Possible causes:
- Inconsistent citation information across locations
- Varying levels of review generation
- Different competitive landscapes
- Some locations newer with less authority
- Local content quality differs
How to investigate:
- Audit each location’s citations individually
- Compare review counts and recency
- Check local pack competitors for each location
- Review location page quality and content uniqueness
Fix: Bring underperforming locations up to the standard of your best performers. Allocate more resources to struggling locations temporarily until they reach baseline performance.
Problem #5: Rankings Dropped Suddenly
Possible causes:
- Google algorithm update
- Competitor improved their SEO
- Technical website issue
- Lost important backlinks
- GBP suspension or violation
- Review bombing (sudden negative reviews)
How to investigate:
- Check Google Algorithm Update trackers
- Review Google Search Console for manual actions or errors
- Check GBP status for suspensions
- Monitor competitor GBP and websites—did they improve?
- Review your recent review activity
Fix: Address technical issues immediately, work on earning back links if lost, respond professionally to negative reviews, improve content quality if competitors out-optimized you.
Pro Tip: When troubleshooting, change one variable at a time. If you make multiple changes simultaneously, you won’t know which one fixed (or broke) things.
The Future of Local SEO Analytics: What’s Coming in 2025 and Beyond
Let’s peer into the crystal ball. Here’s what’s shaping the future of local search analytics.
1. AI-Generated Search Responses (Google SGE Impact)
Google’s Search Generative Experience (SGE) is rolling out, providing AI-generated answers above traditional results.
What this means for local analytics:
- Traditional “position 1” might not mean what it used to
- Visibility in AI-generated responses becomes a new metric to track
- Citation sources for AI answers become crucial
- Structured data and schema markup matter even more
How to prepare:
- Focus on being the authoritative source in your category
- Optimize for featured snippets (AI often pulls from these)
- Ensure your schema markup is perfect
- Create comprehensive, authoritative content that AI would cite
Pro Tip: Start tracking whether your business appears in AI-generated results. This will become a key KPI in 2025.
2. Visual Search and Image Recognition
Google Lens and visual search are growing rapidly. Users can photograph something and search for it.
What this means for local analytics:
- Photo optimization becomes more critical
- Image metadata and alt text matter more
- Product/service photography quality directly affects visibility
How to prepare:
- Add descriptive filenames to images (not “IMG_1234.jpg”)
- Write detailed alt text for all photos
- Use high-quality, unique photos (not stock images)
- Add structured data to images
3. Enhanced Local Inventory and Services Schema
Google is expanding how local businesses can display real-time inventory, services, and availability.
What this means for local analytics:
- Track inventory-related searches
- Monitor service availability queries
- Measure conversion from enhanced listings
How to prepare:
- Implement LocalBusiness schema with service details
- Add inventory feeds if applicable (retail)
- Keep GBP services and attributes updated in real-time
4. Privacy-First Tracking and Cookieless Future
Third-party cookies are dying. Analytics must adapt.
What this means for local analytics:
- First-party data becomes more valuable
- Server-side tracking gains importance
- Consent management affects what you can track
How to prepare:
- Build your own customer database
- Implement server-side Google Tag Manager
- Use Google Analytics 4 (built for privacy-first world)
- Focus on first-party relationships (email, loyalty programs)
5. Hyperlocal Targeting Down to the Street Level
Search is getting more precise. “Near me” might become “on this street.”
What this means for local analytics:
- Track performance at neighborhood/street level, not just city level
- Monitor foot traffic patterns more precisely
- Understand micro-local competition
How to prepare:
- Use tools like Local Falcon for granular geographic tracking
- Create content for specific neighborhoods
- Build relationships with hyperlocal news sites and blogs
6. Integration of Offline and Online Attribution
The line between online search and offline visits is blurring.
What this means for local analytics:
- Better attribution from search to in-store visit
- Integration of point-of-sale data with search analytics
- Understanding true customer lifetime value by acquisition channel
How to prepare:
- Use Google’s store visit tracking (if eligible)
- Implement loyalty programs that track customer journey
- Survey customers about how they found you
- Use unique offers per channel to track offline conversions
Pro Tip: The future favors businesses that own their customer relationships. First-party data (emails, customer accounts, loyalty programs) will be your competitive advantage as third-party tracking diminishes.
Building a Local SEO Analytics Culture in Your Organization
Analytics only work if people actually use them. Here’s how to make data-driven decision-making stick.
Get Leadership Buy-In
Show ROI in terms they care about:
- Revenue, not rankings
- Customer acquisition cost
- Lifetime value by channel
- Competitive positioning
Create executive dashboards:
One-page views showing only the metrics executives care about:
- Total local search revenue
- Month-over-month growth
- ROI on local SEO investment
- Market share vs. competitors
Train Your Team
Different teams need different views:
Marketing team: Full access to all analytics, responsible for interpreting and acting
Sales team: Lead quality metrics, conversion rates, channel attribution
Operations team: Location performance data, customer satisfaction signals from reviews
Executives: High-level dashboards with trends and ROI
Establish Regular Review Cycles
Weekly quick checks (15 minutes):
- Any critical issues? (ranking drops, GBP problems)
- Quick wins identified?
- Traffic and conversion trends
Monthly deep dives (1-2 hours):
- Comprehensive metric review
- Competitive analysis
- Strategy adjustments
- Next month’s priorities
Quarterly strategic reviews (half day):
- Long-term trend analysis
- Major strategy decisions
- Budget allocation
- Tool evaluation and optimization
Create Accountability
Assign metric owners:
- Someone owns GBP optimization and monitoring
- Someone owns review generation and response
- Someone owns content creation based on keyword opportunities
- Someone owns citation management
Set measurable goals with deadlines:
Bad goal: “Improve local SEO”
Good goal: “Increase GBP actions by 25% within 90 days by implementing weekly GBP posts, generating 10 new reviews per month, and optimizing photos.”
Celebrate Wins (And Learn from Losses)
Share success stories:
When analytics reveal a winning strategy, share it company-wide. This builds enthusiasm for data-driven decisions.
Conduct failure analyses:
When something doesn’t work, analyze why without blame. What did the data tell us? What did we learn? What will we do differently?
Pro Tip: Make analytics visible. Display key metrics on office screens or in team communication channels. When data is visible, people pay attention to it.
Frequently Asked Questions About Local SEO Analytics
How long does it take to see results from local SEO efforts in analytics?
Most businesses see initial movement within 30-60 days, but significant results typically take 3-6 months. Here’s a realistic timeline:
- Weeks 1-4: Technical fixes and GBP optimization may show quick wins in impressions
- Months 2-3: Rankings begin to improve, traffic increases
- Months 4-6: Sustained ranking improvements, measurable revenue impact
- Months 6-12: Compound effects as authority builds, potentially doubling or tripling results
However, if you’re in a highly competitive market or starting from zero, expect the longer end of this timeline.
What’s a good benchmark for GBP views and actions?
It varies wildly by industry and location, but here are general benchmarks:
Service businesses (plumbers, electricians, etc.):
- Good: 500-1,000 views/month, 30-60 actions/month
- Excellent: 1,000-2,500 views/month, 60-150 actions/month
Restaurants:
- Good: 1,000-2,500 views/month, 100-250 actions/month
- Excellent: 2,500-5,000+ views/month, 250-500+ actions/month
Professional services (lawyers, dentists, etc.):
- Good: 300-800 views/month, 20-50 actions/month
- Excellent: 800-2,000+ views/month, 50-150+ actions/month
More important than raw numbers: Your month-over-month growth and your action rate (actions ÷ views). A healthy action rate is 5-15%.
Should I track my personal brand or business brand for local SEO?
Both, but prioritize differently based on your business model:
Multi-provider businesses (dental practices with multiple dentists, law firms with multiple partners): Track both the business and individual practitioner names. Many searchers look for specific doctors/lawyers by name.
Single-provider businesses: Your business name and personal name are essentially the same for tracking purposes.
Franchise or chain locations: Focus on the location-specific brand (“McDonald’s Downtown Seattle”) not just the parent brand.
How do I track local SEO for a service area business without a physical address?
Key metrics to focus on:
- GBP views and actions (even with hidden address)
- Rankings from various coordinates within your service area (use Local Falcon)
- Website traffic segmented by city
- Phone calls attributed to specific service areas
- Reviews mentioning different neighborhoods/cities you serve
Use tools like Local Falcon to check rankings from multiple points across your service territory, not just your home base.
What’s the most important local SEO metric to track?
Short answer: Conversions (phone calls, form submissions, direction requests)
Longer answer: It depends on your business model:
- Brick-and-mortar retail: Direction requests + foot traffic
- Service businesses: Phone calls + quote requests
- Professional services: Website form submissions + phone consultations
- Restaurants: Reservations + direction requests + order placements
Track the metrics that most directly connect to revenue for your specific business.
How often should I check my local rankings?
Daily: Not necessary and often stressful (rankings fluctuate)
Weekly: Good for active optimization campaigns or competitive markets
Monthly: Perfect for most businesses
Pro Tip: Set up automated rank tracking that runs weekly, but only review it monthly. This gives you data trends without the stress of daily fluctuations.
Can I track local SEO in Google Analytics 4?
Yes, but it requires setup:
Create segments for local traffic:
- Users from specific cities/regions
- Users who landed on location-specific pages
- Users from organic search containing location keywords
Set up custom dimensions:
- User city
- Landing page type (location page vs. other)
- Device category (mobile is crucial for local)
Create conversion events:
- Phone number clicks
- Direction clicks (external link to maps)
- Form submissions from location pages
GA4 is less intuitive than Universal Analytics was, but it’s more powerful once configured properly.
How do I know if my local SEO analytics setup is working correctly?
Run these tests:
- Call tracking test: Call your tracked number and verify it logs in your analytics
- Form submission test: Submit a test form and confirm it appears as a conversion
- GBP click test: Click your website link from GBP and verify it shows up with proper UTM parameters in GA4
- Ranking spot check: Manually check rankings from an incognito browser with VPN set to your target location—does it match your tracking tool?
Monthly health check:
- Do the numbers make logical sense? (If GBP shows 1,000 website clicks but GA4 shows only 50 sessions from that source, something’s broken)
- Are all integrations still functioning? (Tools disconnect sometimes)
- Are tracking numbers still forwarding correctly?
What should I do when competitors outrank me in local search?
Don’t panic—analyze:
Audit their GBP:
- More reviews?
- Better photos?
- More complete profile?
- Faster review response?
- Better category selection?
Check their website:
- Better location-specific content?
- Faster page speed?
- Better mobile experience?
- More authoritative backlinks?
Review their citation profile:
- More citations?
- Better NAP consistency?
- Listed in directories you’re missing?
Analyze their content strategy:
- More local content?
- Better keyword targeting?
- More engaging formats (video, etc.)?
Then prioritize: Focus on the 1-2 areas where they have the biggest advantage and close that gap.
How do multi-location businesses track analytics separately for each location?
Best practices:
Separate GBP listings: Each location has its own profile with separate Insights
Unique tracking numbers: Each location gets a different phone number for attribution
Location-specific landing pages: Each location has a dedicated page with unique URL
GA4 segments/filters: Create views filtered by city or landing page
Dedicated dashboard sections: Your reporting dashboard should have a section per location
Use a multi-location tool: BrightLocal, SOCi, or similar tools designed for multi-location tracking
This approach lets you identify top performers and diagnose underperformers individually.
Final Thoughts: Your Local SEO Analytics Journey
Here’s the truth about local SEO analytics: most businesses never set it up properly. They throw some tracking on their website, check Google Business Profile occasionally, and hope for the best.
That’s not a strategy. That’s a guess.
The businesses dominating local search in 2025 are the ones treating analytics seriously. They track what matters. They identify patterns. They act on insights. They optimize relentlessly.
You don’t need to be a data scientist. You don’t need expensive tools. You need clarity about what drives your business and discipline to track it consistently.
Start simple:
- Get Google Business Profile Insights working
- Set up basic Google Analytics 4 tracking
- Create one simple dashboard
- Review it weekly for a month
- Expand from there
The businesses that win in local search aren’t the ones with the biggest budgets—they’re the ones with the best data and the discipline to use it.
Your competitors are either tracking this stuff religiously or ignoring it completely. Either way, implementing proper local SEO analytics gives you an advantage.
So stop guessing. Start measuring. And watch your local visibility—and your revenue—grow.
Want to ensure you’re building on a solid foundation? Check out this comprehensive guide to local SEO strategy that covers the tactics your analytics will be measuring.
What’s holding you back from implementing proper local SEO analytics? Is it time, knowledge, budget, or something else? The longer you wait, the more opportunities you’re missing. Set aside this week to implement the 30-day plan from this guide. Your future self will thank you.