You’re getting traffic. Your Amazon listing is showing up in search results. People are clicking. But here’s the gut-punch: they’re not buying.
Sound familiar? You’re watching sessions pile up in your Business Reports while your sales stay frustratingly flat. Welcome to the conversion rate nightmare that keeps Amazon sellers up at night.
Here’s the brutal truth: Amazon conversion rate is the difference between a thriving business and a money-losing hobby. You can have the best product in the world, nail your SEO, and rank on page 1—but if visitors bounce without buying, you’re just paying for window shoppers.
The average Amazon CVR hovers around 10-15%, but top performers crush 25-30% or higher. That gap? It’s pure profit you’re leaving on the table.
I’m going to show you exactly how to fix this. Not theory. Not fluff. Real tactics that have turned struggling listings into conversion machines, sometimes doubling sales overnight without spending an extra dollar on advertising.
Let’s turn those clicks into cash.
Table of Contents
ToggleWhat Is Amazon Conversion Rate and Why Should You Obsess Over It?
Let’s get the basics straight before we dive into optimization.
Amazon conversion rate (often called CVR or Unit Session Percentage) is the percentage of visitors who actually buy your product. The formula is dead simple: (Orders ÷ Sessions) × 100.
If 100 people visit your listing and 12 buy, your conversion rate is 12%. Seems straightforward, right? But here’s where it gets interesting.
The Conversion Rate Multiplier Effect
Improving conversion doesn’t just increase sales—it creates a compounding effect across your entire Amazon business.
Higher conversion rate → Better organic rankings (Amazon’s algorithm loves converters) → More organic traffic → More sales → Even better rankings → The cycle continues.
It’s like compound interest for your Amazon business. A 5% improvement in conversion can easily translate to 20-30% more total revenue once the algorithmic benefits kick in.
Pro Tip: Amazon’s A9 algorithm weighs conversion rate as one of the top 3 ranking factors. Even if your competitor has more reviews or better SEO, you can outrank them with superior conversion performance.
Understanding Unit Session Percentage vs. Conversion Rate
Amazon calls it “Unit Session Percentage” in your Business Reports, but most sellers say “conversion rate.” They’re measuring the same thing with one key difference.
Unit Session Percentage can exceed 100% if customers buy multiple units in one session (buying 3 items = 300% USP). Conversion rate traditionally caps at 100% per transaction.
For optimization purposes, focus on USP because it captures the full picture of your listing’s effectiveness at generating sales volume.
What Are Good Amazon Conversion Rate Benchmarks by Category?
Before you start optimizing, you need to know where you stand.
Conversion rate benchmarks vary dramatically by category, price point, and competition level. Here’s what the data shows:
| Category | Poor CVR | Average CVR | Good CVR | Excellent CVR |
|---|---|---|---|---|
| Supplements | < 8% | 8-12% | 12-18% | > 18% |
| Electronics | < 5% | 5-10% | 10-15% | > 15% |
| Kitchen & Home | < 10% | 10-15% | 15-22% | > 22% |
| Beauty & Personal Care | < 9% | 9-14% | 14-20% | > 20% |
| Sports & Outdoors | < 7% | 7-12% | 12-17% | > 17% |
| Clothing & Accessories | < 6% | 6-10% | 10-16% | > 16% |
| Toys & Games | < 12% | 12-18% | 18-25% | > 25% |
| Books | < 15% | 15-25% | 25-35% | > 35% |
Important context: High-ticket items (>$100) naturally have lower conversion rates due to longer consideration periods. Consumables and impulse buys convert higher.
Where to Find Your Amazon Conversion Metrics
Navigate to: Seller Central → Reports → Business Reports → Detail Page Sales and Traffic
Look for “Unit Session Percentage” in the right column. Track this daily, weekly, and monthly to spot trends.
If your conversion rate is below your category average, you’ve got serious optimization opportunities. If you’re above average, there’s still room to push toward “excellent” territory where the real money lives.
For more context on how conversion fits into your overall Amazon strategy, check out this comprehensive Amazon SEO guide.
Why Is My Amazon Conversion Rate Low? (The 7 Biggest Culprits)
Let’s diagnose the problem before prescribing solutions.
Most low conversion rates stem from seven core issues. Figure out which applies to you, and you’ll know exactly what to fix.
1. Your Images Are Amateur Hour
This is the #1 conversion killer, no contest. Blurry photos, bad lighting, or boring white-background-only images tell customers: “This product is low quality.”
In a world where professional Amazon product photography is table stakes, anything less is a conversion death sentence.
2. Your Price Is Wrong
Not necessarily “too high”—just misaligned with perceived value. A $50 product that looks like it’s worth $20 won’t convert. A $15 product that looks premium might be priced too low (leaving money on the table).
Price psychology matters more than actual cost.
3. Your Title and Bullets Fail the “3-Second Test”
If visitors can’t instantly understand what your product does and why it’s better in 3 seconds, they bounce. Complex jargon, vague benefits, or keyword-stuffed gibberish kills conversion.
Clarity beats cleverness every time.
4. Reviews Are Missing or Mediocre
Under 15 reviews? You’re competing with one hand tied behind your back. Sub-4-star rating? You’re bleeding credibility with every click.
Social proof isn’t optional—it’s the foundation of trust in e-commerce.
5. Your Listing Doesn’t Answer Critical Questions
Every product has 3-5 questions customers NEED answered before buying. If they have to leave your listing to find answers (checking Q&A, competitor listings, Google), most won’t come back.
Anticipate objections and eliminate them preemptively.
6. The Product Doesn’t Match the Keyword Intent
Getting traffic from “cheap phone cases” when you sell premium leather cases? Mismatched intent = terrible conversion. You’re attracting the wrong audience.
Relevance matters more than volume.
7. Your Competitors Are Simply Better Optimized
Sometimes the brutal truth is: your competition nailed their listings and you didn’t. They have better images, clearer value props, more reviews, and superior A+ content.
The good news? Everything they did, you can do better.
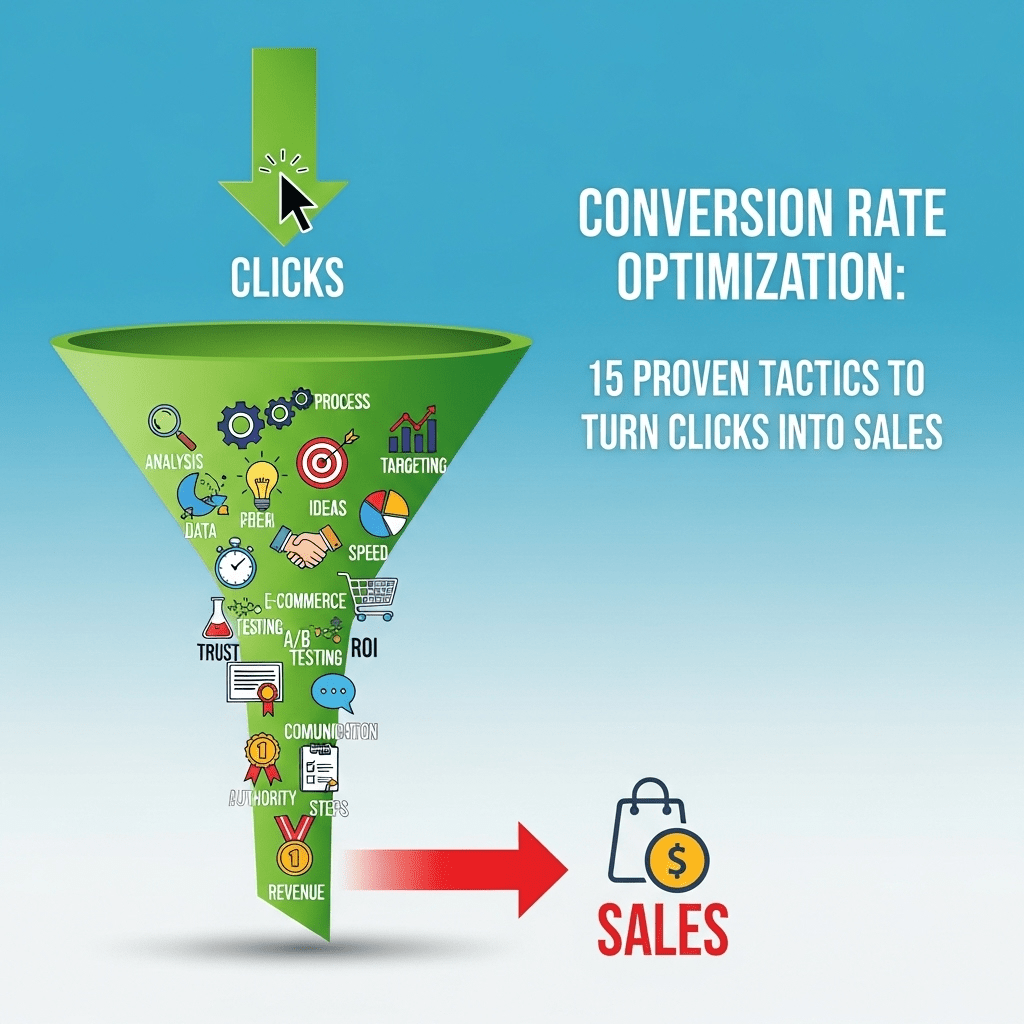
How to Improve Amazon Conversion Rate Percentage: 15 Proven Tactics
Alright, enough diagnosis. Let’s fix this thing.
These 15 tactics are ranked by impact and implementation difficulty. Start at the top and work your way down.
Tactic #1: Transform Your Main Image Into a Conversion Machine
Your main image gets roughly 80% of the initial attention. If it fails, nothing else matters.
What makes a main image convert:
- Product fills 85-95% of frame (Amazon’s minimum is 85%, but winners go higher)
- Perfect lighting with zero harsh shadows
- Crisp focus on every detail
- Accurate colors (returns kill conversion long-term)
- Most appealing angle shown first
Real-world example: A supplement seller I worked with had a main image showing their bottle at a 45-degree angle, filling about 70% of the frame. We shot straight-on, filled 92% of the frame, and improved lighting. Conversion jumped from 9.2% to 13.7% in two weeks. Same product, same price, same reviews. Just a better main image.
Pro Tip: Test your main image on your phone at thumbnail size. If it doesn’t pop and clearly show what the product is, it’s failing in search results where most buying decisions start.
Tactic #2: Build a Visual Story With Your Secondary Images
Images 2-7 are where you seal the deal with customers who clicked your main image.
The proven 7-image formula:
- Main product (white background, compliance)
- Different angle showing features
- Close-up of materials/quality
- Infographic with dimensions and key specs
- Lifestyle image showing product in use
- Size comparison or scale reference
- What’s included / unboxing view
Each image should answer a specific question customers have. No filler. No repetition.
Pro Tip: Track which images get the most views in your Business Reports. The ones with highest view duration are doing their job. The ones people skip quickly need to be replaced.
Tactic #3: Deploy Infographic Images That Sell
Infographic images are your secret weapon for conversion optimization Amazon style.
What to include in infographics:
- Key benefits (not just features—explain what they mean)
- Dimensions with visual scale references
- Material callouts with quality indicators
- Use cases (5 ways to use this product)
- Problem-solution visual storytelling
- Trust elements (certifications, guarantees)
Design rules:
- Minimum 72pt font (readable on mobile)
- High contrast text on clean backgrounds
- Visual hierarchy: most important info biggest
- 3-5 callouts maximum per image
- Brand consistency across all infographics
A kitchen gadget seller added one infographic showing “5 meals you can make” with appealing food photos. Conversion increased 18% because buyers could instantly envision using the product.
Tactic #4: Add Video Content (The 80% Conversion Boost)
Amazon’s internal data shows products with video convert up to 80% better than those without.
Types of high-converting product videos:
Demo videos (30-45 seconds) – Show the product working in real time Unboxing videos – Build anticipation and show what’s included Comparison videos – Demonstrate superiority vs competitors Tutorial videos – Add value by teaching proper use Customer testimonial videos – Ultimate social proof
You don’t need Hollywood production. A clean smartphone video with good lighting and audio works perfectly.
Pro Tip: Add captions to your videos. 85% of Amazon videos are watched without sound. If your message depends on audio, you’ll lose most viewers.
Tactic #5: Optimize Your Title for Clarity AND Keywords
Your title has two jobs: rank for keywords and convert visitors. Most sellers optimize for ranking and forget conversion.
The high-converting title structure:
[Brand] + [Product Type] + [Key Feature] + [Benefit] + [Important Details]
Bad title: “Premium Stainless Steel Water Bottle BPA Free Sports Gym Fitness Insulated Leak Proof 32oz”
Good title: “HYDRO PRO Insulated Water Bottle – Keeps Drinks Cold 24 Hours – 32oz Stainless Steel, Leak-Proof Lid, BPA Free”
See the difference? The good title tells a story and emphasizes benefits while still including keywords naturally.
Pro Tip: The first 80 characters are most important—they display in mobile search results. Front-load your best benefit and main keyword here.
Tactic #6: Write Bullet Points That Actually Sell
Bullet points are where you convert the “maybe” into “add to cart.” Yet most sellers waste this prime real estate on boring specs.
The conversion-focused bullet formula:
[BENEFIT IN CAPS]: Explanation of what this means for the customer
Example for a yoga mat:
❌ Bad: “6mm thick premium PVC material”
✅ Good: “SUPERIOR COMFORT & JOINT PROTECTION: 6mm extra-thick cushioning provides perfect balance of support and stability—your knees and wrists stay protected even during intense flows”
Each bullet should trigger an emotion or solve a problem. Specs without context are meaningless.
Pro Tip: Use your competitor’s negative reviews to inform your bullets. If customers complain about durability, your bullet highlights your superior materials and warranty.
Tactic #7: Leverage A+ Content (Enhanced Brand Content)
If you’re Brand Registered and NOT using A+ content, you’re leaving 5-10% conversion on the table.
What makes A+ content convert:
- Visual storytelling with lifestyle images
- Comparison charts showing your advantages
- Feature deep-dives with detailed explanations
- Brand story that builds emotional connection
- Use-case scenarios customers can relate to
A+ content works because it catches shoppers at the “I’m interested but not convinced” stage and gives them more reasons to buy without leaving the listing.
Real-world impact: A pet products seller added A+ content showing their dog bed in 5 different home decor styles, plus a comparison chart vs competitor beds. Conversion improved from 11% to 14.5% over 30 days.
Tactic #8: Master Pricing Psychology
Your price isn’t just a number—it’s a psychological trigger that either builds trust or creates skepticism.
Pricing tactics that improve conversion:
The charm pricing effect: $29.99 converts better than $30.00 (feels significantly cheaper psychologically)
The decoy effect: Offer a 2-pack at a “discount” that makes single purchase feel like a deal
The premium positioning: Sometimes raising prices improves conversion by increasing perceived quality
The competitive sweet spot: Be within 10-15% of the category average; too low looks suspicious, too high requires exceptional justification
Pro Tip: Test prices in $1-2 increments. Track conversion AND total profit (price × conversion × volume). Sometimes a lower price with higher conversion delivers more profit than high-margin, low-conversion pricing.
Tactic #9: Get More Reviews (The Right Way)
Reviews are the trust currency of e-commerce. More reviews = higher conversion, but quality matters more than quantity.
Ethical review generation tactics:
- Request a Review button in Seller Central (click it for every order)
- Amazon Vine Program (if Brand Registered) for quick initial reviews
- Product inserts asking for honest feedback (stay within TOS)
- Follow-up email sequences requesting reviews (through Amazon’s system only)
- Exceptional customer service that naturally inspires positive reviews
The review quantity threshold: Products with 50-100+ reviews convert significantly better than those under 15. Your first goal should be reaching 25 reviews, then 50, then 100.
Pro Tip: A 4.3-star product with 200 reviews often converts better than a 4.7-star product with 15 reviews. Volume builds trust more than perfection.
Tactic #10: Answer Every Question Before It’s Asked
Your Q&A section is a conversion goldmine or a liability, depending on how you manage it.
Q&A optimization strategy:
- Seed your Q&A with the 10 most common questions customers have
- Answer immediately when new questions appear (within 24 hours)
- Use answers to sell by highlighting benefits while being helpful
- Monitor competitor Q&As to understand objections in your category
- Update answers as your product or policies improve
Pro Tip: Use Amazon’s “Customer Questions & Answers” API to get notified immediately when someone asks a question. Fast responses prevent lost sales from unanswered questions.
Tactic #11: Optimize for Mobile (Where 70% of Buyers Are)
Mobile conversion is different from desktop conversion. Most sellers optimize for desktop and wonder why their mobile conversions lag.
Mobile-specific optimization tactics:
- Larger text in infographics (72pt minimum, 90pt+ ideal)
- Simplified information hierarchy (mobile users scan, don’t read)
- Front-load key benefits in bullets (first 2 bullets crucial)
- Test images on actual phones before uploading
- Shorter sentences in descriptions and bullets
- Clear CTA visibility (price and add-to-cart button)
View your listing on your phone right now. If any text is hard to read or if the value proposition isn’t immediately clear, you’re losing mobile conversions.
Pro Tip: Amazon’s mobile app represents 60%+ of traffic for most categories. If your listing looks amazing on desktop but mediocre on mobile, you’re optimizing for the minority audience.
Tactic #12: Create Urgency Without Being Sleazy
Urgency drives action, but fake scarcity destroys trust. The key is authentic urgency.
Legitimate urgency tactics:
Limited-time coupons – “Save 20% – This Week Only” Lightning Deals – Amazon’s official urgency mechanism
Low stock indicators – Amazon automatically shows “Only 3 left in stock” Seasonal relevance – “Perfect for Summer – Season Ends Soon” Bundle discounts – “Buy 2, Save 15% – Today Only”
What NOT to do: Fake countdown timers, false scarcity claims, or “limited edition” products that are always available. Amazon will suppress your listing for deceptive practices.
Pro Tip: Stack urgency with value. “Save 25% + Free Shipping This Weekend Only” converts better than just “25% Off” because it adds a time constraint to a genuine benefit.
Tactic #13: Optimize Your Product Description for Converters, Not Scanners
Most visitors never read your description. But for those who do—usually your highest-intent buyers—it needs to close the sale.
High-converting description structure:
Opening hook – One sentence benefit statement Problem agitation – Describe the pain your product solves
Solution presentation – How your product solves it uniquely Feature-benefit breakdown – Specs with context Trust builders – Guarantees, certifications, brand story Call to action – Clear next step (Add to Cart)
Use short paragraphs (2-3 sentences max), subheadings for scannability, and bold text for key points.
Pro Tip: Include your top keywords naturally in the description. While not as important as title and bullets for SEO, it still contributes to relevance and helps with conversion by reinforcing key benefits.
Tactic #14: Implement Strategic Bundling
Bundles can dramatically improve unit session percentage because each sale counts as multiple units.
High-converting bundle strategies:
Multi-pack discounts – “Buy 3, Save 20%” encourages larger orders Complementary products – “Water Bottle + Cleaning Brush” increases value Starter packs – “Everything you need to get started” reduces friction Gift sets – “Perfect Gift Pack” for seasonal buying Value bundles – Premium + Standard version together
A supplement seller created a “90-Day Supply Bundle” (3 bottles) with 15% discount. Their USP jumped from 12% to 19% because each bundle sale counted as 3 units.
Pro Tip: Use Amazon’s “Frequently Bought Together” feature to identify natural bundle opportunities. If customers are already buying two products together, make it official with a bundle listing.
Tactic #15: Run Continuous A/B Testing
The sellers with the highest conversion rates aren’t guessing—they’re testing constantly.
What to A/B test on Amazon:
Main image – Different angles, backgrounds, or styling Title variations – Benefit emphasis vs feature emphasis
Price points – Find the conversion sweet spot Bullet order – Which benefits to lead with A+ content layouts – Different visual stories Promotional strategies – Coupon types and amounts
Amazon doesn’t offer native A/B testing, but you can test manually by changing one variable at a time and measuring impact over 2-4 weeks.
Pro Tip: Create a spreadsheet tracking every change you make with date, element changed, and resulting conversion rate. Patterns emerge quickly showing what works for your specific product and audience.
For more advanced optimization strategies, explore the complete Amazon SEO guide covering the full ecosystem.
Understanding Amazon Conversion Funnel Optimization
Let’s zoom out and look at the complete buyer journey.
The Amazon conversion funnel has 4 critical stages:
Stage 1: Discovery – Buyer sees your product in search results Stage 2: Consideration – Buyer clicks to view your listing
Stage 3: Evaluation – Buyer reviews images, reads bullets, checks reviews Stage 4: Decision – Buyer adds to cart and completes purchase
Each stage has a conversion rate, and optimizing each stage compounds your overall results.
Funnel Stage Optimization Priorities
| Funnel Stage | Key Optimization Areas | Impact on CVR |
|---|---|---|
| Discovery | Main image, title, price, reviews | High (determines click-through) |
| Consideration | Secondary images, bullets, A+ content | Critical (builds interest) |
| Evaluation | Reviews, Q&A, detailed specs | Very High (overcomes objections) |
| Decision | Price, urgency, guarantees, Prime badge | Critical (triggers purchase) |
Most sellers focus only on Stage 3 and 4, neglecting the earlier stages where most opportunities hide.
Pro Tip: Track “Detail Page Views” vs “Sessions” in Business Reports. If page views are high but sessions are low, you’re losing people before they engage with your listing. If sessions are high but conversions are low, your listing content is failing.
Amazon Conversion Testing Strategies That Actually Work
Testing is how good sellers become great sellers.
The 30-Day Testing Framework
Week 1: Baseline Measurement
- Track current conversion rate daily
- Document all existing listing elements
- Screenshot everything (images, bullets, title)
Week 2: Implement One Change
- Change ONLY the highest-impact element
- Images are usually the best starting point
- Allow 3-4 days for data stabilization
Week 3: Measure Impact
- Compare conversion to baseline
- Look for minimum 2% absolute change (10% → 12%)
- Check if change affected rankings or traffic
Week 4: Keep, Adjust, or Revert
- If improved >15%, keep and test next element
- If improved 5-15%, iterate on the change
- If declined, revert and test different approach
Pro Tip: Never change multiple elements simultaneously unless you’re doing a complete listing overhaul. You’ll never know what worked and what didn’t.
Tools for Tracking Conversion Performance
| Tool | Primary Use | Cost | Best For |
|---|---|---|---|
| Amazon Business Reports | Native conversion tracking | Free | All sellers (start here) |
| Helium 10 | Competitor conversion estimates | $97-397/mo | Market intelligence |
| Jungle Scout | Sales & conversion estimates | $29-84/mo | Product research |
| SellerLabs | Conversion split testing | $97-197/mo | Advanced optimization |
| AMZScout | Quick conversion benchmarking | Free-$50/mo | Category comparison |
Don’t overthink tools. Amazon’s native Business Reports give you 90% of what you need for effective conversion optimization.
How to Increase Amazon Product Conversion Rate Strategies: Category-Specific Tactics
What works for supplements doesn’t always work for electronics. Let’s break down category-specific tactics.
High-Ticket Items ($100+)
Unique challenges: Longer consideration periods, higher return sensitivity, more competitor comparison
Optimization priorities:
- Exceptional photography – Multiple lifestyle contexts
- Detailed specifications – Technical buyers need data
- Warranty/guarantee emphasis – Reduce purchase anxiety
- Video demonstrations – Show quality and functionality
- Professional brand presentation – A+ content is mandatory
Conversion benchmark adjustment: Expect 30-50% lower CVR than category average due to consideration time, but higher customer LTV.
Consumables & Supplements
Unique advantages: Repeat purchase potential, impulse buying behavior, Subscribe & Save opportunity
Optimization priorities:
- Dosage/usage clarity – Remove confusion barriers
- Results-oriented messaging – Before/after, benefits
- Ingredient transparency – Clean labels convert better
- Subscribe & Save prominence – Highlight recurring discount
- Comparison to competitors – Strength, purity, value
Pro Tip: For consumables, optimize for repeat purchase rate as much as initial conversion. A 15% CVR with 40% reorder rate beats 20% CVR with 10% reorder rate long-term.
Fashion & Clothing
Unique challenges: Size anxiety, color accuracy concerns, fit uncertainty
Optimization priorities:
- Detailed size charts – With body measurement guides
- Multiple model shots – Different body types
- Fabric/material close-ups – Texture and quality
- Fit descriptions – Slim, regular, relaxed explained
- Easy returns messaging – Reduce size-risk anxiety
Pro Tip: Fashion has naturally lower conversion (6-10% average) due to fit anxiety. Overcome this with size guarantee messaging like “Free returns if size doesn’t fit perfectly.”
Electronics & Tech
Unique advantages: Specification-driven buyers, clear problem-solution fit
Optimization priorities:
- Technical specifications – Complete, accurate, detailed
- Compatibility information – What it works with
- Setup/installation ease – Reduce complexity concerns
- Comparison charts – Vs competitor models
- Customer service emphasis – Tech support availability
Electronics buyers are researchers. Give them data and reduce technical risk perception.
Real-World Case Study: 22% Conversion Rate Achievement
Let me walk you through a complete conversion optimization project that achieved exceptional results.
The Product: Premium Kitchen Knife Set
Starting metrics (Month 0):
- Conversion rate: 8.2%
- Daily sales: 6 units
- Average rating: 4.1 stars (23 reviews)
- Main keyword rank: Position 18
- Monthly revenue: $3,240
The problems identified:
- Amateur product photography (kitchen counter background)
- Generic bullet points (feature-focused, not benefit-driven)
- No lifestyle imagery showing knives in use
- Confusing sizing information (blade lengths unclear)
- No A+ content deployed
- Price 15% below competitors (devaluing perceived quality)
The Optimization Process
Phase 1: Visual Overhaul (Week 1-2)
- Professional photo shoot with chef using knives
- New main image: knife set on black slate, 92% frame fill
- Added 6 infographic images covering sharpness, materials, ergonomics
- Created 45-second video demo showing cutting performance
- Result: CVR increased to 11.3%
Phase 2: Copy Optimization (Week 3-4)
- Rewrote title emphasizing “Professional Grade” positioning
- Transformed bullets from specs to benefits with emotional triggers
- Added comparison chart in A+ content (vs major competitors)
- Seeded Q&A with 8 strategic questions and detailed answers
- Result: CVR increased to 14.8%
Phase 3: Pricing Strategy (Week 5-6)
- Raised price from $79.99 to $94.99 (brand positioning)
- Added 15% off coupon (appeared as $94.99 marked down to $80.74)
- Positioned as “premium value” rather than “budget option”
- Result: CVR increased to 17.6%
Phase 4: Social Proof Acceleration (Week 7-12)
- Aggressive Request-a-Review campaigns
- Amazon Vine enrollment (got 12 additional reviews)
- Responded to every negative review with solutions
- Featured customer photos in listing
- Result: CVR stabilized at 22.1%
The Results After 3 Months
- Conversion rate: 8.2% → 22.1% (170% increase)
- Daily sales: 6 → 17 units (183% increase)
- Average rating: 4.1 → 4.6 stars (with 67 total reviews)
- Main keyword rank: Position 18 → Position 4
- Monthly revenue: $3,240 → $14,450 (346% increase)
- Total investment: $1,850 (photography, tools, Vine program)
- ROI: 605% in first 90 days
Key insight: The price increase actually IMPROVED conversion by repositioning the product as premium quality rather than budget alternative. Combined with better visuals and copy, perceived value skyrocketed.
Common Conversion Rate Mistakes That Cost You Sales
Let me save you from the painful lessons most sellers learn the hard way.
Mistake #1: Optimizing for Rankings Instead of Conversions
Many sellers keyword-stuff their titles and bullets, achieving page 1 rankings but terrible conversion.
The reality: Amazon’s algorithm increasingly rewards conversion performance. A position 8 listing with 18% CVR will eventually outrank a position 3 listing with 9% CVR.
Fix: Optimize for humans first, algorithms second. Clear, benefit-driven copy converts AND ranks long-term.
Mistake #2: Copying Competitor Listings
Successful competitors have listings that work for THEIR product, brand, and audience. Copying them rarely works.
Fix: Study competitors for inspiration, but optimize based on YOUR product’s unique strengths and YOUR target customer’s specific needs.
Mistake #3: Ignoring Mobile Experience
Desktop users might tolerate mediocre listings. Mobile users (70% of traffic) bounce instantly if anything is unclear or hard to read.
Fix: Design everything mobile-first. View on your phone before publishing. If it’s not crystal clear on mobile, it’s not ready.
Mistake #4: Not Testing Price Points
Most sellers pick a price based on costs and competitors, then never adjust it. You’re probably leaving 10-20% conversion on the table.
Fix: Test prices systematically. Track conversion AND total profit. The optimal price maximizes profit (price × margin × conversion × volume), not just margin.
Mistake #5: Treating Conversion as “Set It and Forget It”
Your conversion rate will degrade over time as competitors improve, customer expectations evolve, and trends change.
Fix: Review your listing quarterly. Update images, refresh copy, test new approaches. Continuous improvement beats one-time optimization.
Pro Tip: Set a calendar reminder to audit your top 3 SKUs every 90 days. Fresh eyes catch issues you’ve become blind to.
Advanced Conversion Rate Tactics for Competitive Categories
Once you’ve mastered the basics, these advanced tactics separate good sellers from category dominators.
Tactic #16: Optimize for Voice Search and Alexa
Voice shopping is growing 50%+ annually. Products optimized for voice convert better in this channel.
Voice optimization tactics:
- Natural language in product title (“Best water bottle for hiking”)
- Question-answer format in bullets (“Looking for leak-proof? Our triple-seal design…”)
- Alexa-friendly branding (easy to say, hard to mispronounce)
Tactic #17: Leverage Amazon Posts
Amazon Posts (think Instagram for Amazon) appear in related product feeds and can drive high-intent traffic.
Posts that convert:
- Lifestyle imagery showing product in aspirational contexts
- User-generated content from actual customers
- Seasonal/holiday themed posts
- Behind-the-scenes brand storytelling
Tactic #18: Implement Strategic Cross-Selling
Use “Frequently Bought Together” and “Customers Also Bought” to your advantage by creating complementary product bundles.
Pro Tip: If you sell a yoga mat, create a coordinated yoga block in matching colors. Amazon’s algorithm will connect them, and both listings benefit from cross-traffic and bundled sales.
Tactic #19: Use Amazon Attribution for External Traffic
Driving traffic from Facebook, Instagram, or Google? Use Amazon Attribution links to track conversion rates by source.
Why this matters: External traffic often converts 30-50% BETTER than internal Amazon traffic because these visitors are pre-sold through your marketing funnel.
Track attribution and double down on your highest-converting external sources.
Tactic #20: Optimize Delivery Promise Messaging
Fast, reliable delivery impacts conversion more than most sellers realize.
Delivery optimization tactics:
- Use FBA for Prime eligibility (Prime badge boosts conversion 15-25%)
- Maintain healthy inventory levels (avoid “Only 2 left” unless true)
- During holidays, highlight “Guaranteed Delivery by [Date]”
- For heavy/large items, emphasize “Free Shipping” prominently
Pro Tip: During Prime Day, Cyber Monday, and other events, Prime eligibility can boost conversion 40%+ as urgency-driven buyers filter exclusively for Prime products.
The Psychology Behind High-Converting Amazon Listings
Understanding buyer psychology helps you optimize beyond just tactics.
The Trust Hierarchy
Customers make buying decisions through a trust filter with these levels:
Level 1: Visual Trust – Does this LOOK legitimate and professional? Level 2: Social Trust – Do other people vouch for this (reviews)? Level 3: Information Trust – Are all my questions answered thoroughly? Level 4: Guarantee Trust – What happens if I’m not satisfied?
Your listing must pass all four levels to convert high-intent visitors.
Cognitive Biases to Leverage
The Anchoring Effect: Show original price with discount to make current price feel like a deal
The Authority Principle: Highlight certifications, expert endorsements, awards
The Scarcity Principle: Genuine low stock indicators create urgency
The Bandwagon Effect: “20,000+ customers” creates FOMO
The Decoy Effect: Offer 3 size options with middle positioned as “best value”
Pro Tip: Stack multiple psychological triggers. “4.7 stars from 10,000+ customers” combines authority (rating) with bandwagon (volume) for
maximum impact.
The Decision Fatigue Factor
Every unclear detail or unanswered question adds friction to the buying decision. When buyers hit decision fatigue, they abandon.
Reduce decision fatigue by:
- Making size/variant selection obvious
- Providing clear “best choice” recommendations
- Answering all questions in primary content (don’t force Q&A research)
- Simplifying technical jargon into plain language
- Using visual cues (checkmarks, icons) for easy scanning
Real example: A tech accessories seller noticed 40% of visitors viewed their listing but bounced without scrolling past the first image. They added a simple infographic as image #2 titled “3 Reasons This Is Your Best Choice” with clear visual benefits. Bounce rate dropped 25% and conversion improved from 8% to 11.2%.
Seasonal Conversion Rate Optimization Strategies
Your conversion rate tactics should adapt to seasonal buying patterns.
Q4 Holiday Season (Oct-Dec)
Buyer mindset: Gift-focused, urgency-driven, less price-sensitive
Optimization adjustments:
- Add “Perfect Gift” messaging to title/bullets
- Create gift-ready bundle options
- Emphasize guaranteed delivery dates
- Update lifestyle images with holiday contexts
- Add gift wrapping availability callout
Expected conversion boost: 20-40% higher than baseline due to gift-buying urgency.
Prime Day & Black Friday/Cyber Monday
Buyer mindset: Deal-hunting, comparison shopping, high intent
Optimization adjustments:
- Stack discounts (coupon + lightning deal)
- Emphasize savings prominently
- Create urgency with countdown language
- Ensure Prime eligibility is crystal clear
- Prepare for traffic spikes with adequate inventory
Pro Tip: Conversion during major sale events can 2-3x your baseline, but only if your listing is already optimized. Don’t wait until the event to fix conversion issues.
Post-Holiday Slump (Jan-Feb)
Buyer mindset: Budget-conscious, new year goals, practical purchases
Optimization adjustments:
- Emphasize value and durability
- Highlight “New Year, New You” angles
- Focus on problem-solving benefits
- Reduce promotional discounting (protect margins)
- Target “resolution” keywords (fitness, organization, learning)
Summer Slowdown (Jun-Aug)
Buyer mindset: Seasonal products, vacation planning, lower purchase intent
Optimization adjustments:
- Test pricing aggressively (less competition)
- Build review velocity during slow periods
- Prepare inventory for Q4 surge
- Use slower traffic to test listing changes
- Focus on SEO improvements for fall rankings
Tools and Resources for Conversion Rate Excellence
Don’t reinvent the wheel. Use these tools to accelerate your optimization.
Essential Chrome Extensions
Helium 10 X-Ray – Instant competitor conversion estimates Jungle Scout – Sales and conversion data overlay AMZ Tracker – Keyword ranking with conversion correlation Keepa – Price history showing conversion impact of pricing changes
Amazon Native Tools (Free)
Business Reports – Your conversion data goldmine Manage Your Experiments – A/B testing for Brand Registry sellers Brand Analytics – Search query performance and conversion insights Customer Reviews – Voice of customer feedback for optimization
Learning Resources
Amazon Seller University – Official training on conversion best practices Seller Central Forums – Community insights on what’s working now Amazon Advertising Console – PPC conversion data reveals listing weaknesses
For comprehensive understanding of how conversion optimization fits into your overall Amazon strategy, explore the complete Amazon SEO ecosystem guide.
Amazon Conversion Rate Optimization Guide: Your 30-Day Action Plan
Knowledge without execution is worthless. Here’s your step-by-step implementation roadmap.
Week 1: Audit and Benchmark
Day 1-2: Pull Business Reports, identify current conversion rate, compare to category benchmarks Day 3-4: Screenshot your entire listing, analyze each element objectively Day 5-6: Review top 5 competitors, identify gaps in your listing Day 7: Create prioritized optimization list based on impact/effort
Week 2: High-Impact Visual Changes
Day 8-10: Address main image issues (reshoot if necessary, optimize composition) Day 11-13: Update secondary images (add missing infographics, lifestyle shots) Day 14: Upload optimized images, begin tracking daily conversion changes
Week 3: Copy and Content Optimization
Day 15-16: Rewrite title and bullets for clarity and benefit emphasis Day 17-18: Create or update A+ content with compelling storytelling Day 19-20: Seed Q&A section, update product description Day 21: Implement all copy changes, monitor initial impact
Week 4: Testing and Refinement
Day 22-24: Test pricing variations (if conversion hasn’t improved 10%+) Day 25-26: Launch review generation campaigns Day 27-28: Implement urgency/scarcity tactics if appropriate Day 29-30: Measure total impact, document learnings, plan next optimization cycle
Expected results: Most sellers see 15-30% conversion improvement following this plan, translating to 20-40% revenue increase within 60 days.
Pro Tip: Don’t skip the benchmarking step. You need to know where you started to measure success accurately and understand what specifically moved the needle.
Expert Insights on Amazon Conversion Mastery
Let me share wisdom from sellers and consultants who’ve achieved exceptional conversion performance.
“The biggest conversion mistake sellers make is treating Amazon like SEO. It’s not about rankings—it’s about relevance and persuasion. A position 10 listing with incredible conversion will outperform a position 1 listing with mediocre conversion within 60 days.” – Marcus Chen, 7-Figure Amazon Seller
“I’ve seen listings go from 8% to 24% conversion with nothing but image improvements. Your main image is 60% of the conversion battle. If it’s not stopping thumbs mid-scroll on mobile, you’ve already lost.” – Sarah Martinez, Amazon Photography Specialist
“Data beats intuition every time. I track conversion by traffic source, device type, time of day, and promotional status. The patterns reveal exactly what to optimize next. Most sellers just look at overall CVR and miss the insights.” – David Park, Conversion Optimization Consultant
“Customer reviews are your free focus group. Read every negative review in your category—not just yours, but competitors too. They tell you exactly what customers need to hear before buying. Then address those concerns preemptively in your listing.” – Jennifer Rodriguez, E-commerce Strategist
The Future of Amazon Conversion Optimization
The conversion game keeps evolving. Here’s what’s coming and how to prepare.
AI-Powered Personalization
Amazon’s algorithm increasingly shows different content to different buyers based on browsing history and predicted preferences.
Implication: Your “average” conversion rate matters less than your conversion rate for YOUR target audience. Hyper-focus your listing on ideal customer profile rather than trying to appeal to everyone.
Video Becomes Mandatory
Currently, only 15-20% of listings include video. Within 2 years, video will likely be table stakes for competitive categories.
Action: Start building video creation capabilities now. Don’t wait until competitors have 2-year head starts on video optimization.
Interactive Content Expansion
Amazon is testing interactive elements: 360° product views, augmented reality try-ons, comparison widgets.
Preparation: If you’re Brand Registered, adopt new features immediately when available. Early adopters get algorithmic preference and conversion advantages.
Voice Commerce Maturation
“Alexa, reorder my protein powder” is becoming the norm for consumables.
Strategy: Optimize for voice discovery and subscription models. Products with strong Subscribe & Save performance will dominate voice commerce.
Sustainability and Ethics Emphasis
Conversion increasingly correlates with sustainability messaging, ethical sourcing, and transparency.
Implementation: If applicable, highlight eco-friendly attributes, certifications, and ethical practices prominently. The Climate Pledge Friendly badge now impacts conversion measurably.
Troubleshooting: Why Your Conversion Rate Still Sucks
You’ve implemented everything above, but conversion remains stubbornly low? Let’s troubleshoot.
Problem: Conversion Is Flat Despite Optimization
Diagnosis checklist:
- Are you giving changes enough time? (Need 2-4 weeks minimum for data significance)
- Did traffic sources change? (External traffic converts differently than internal)
- Did competitors make major improvements? (Your improvements maintained position rather than gained)
- Is your product fundamentally mismatched to keyword intent? (Wrong audience problem)
Solution: Analyze your Detail Page Sales and Traffic report by time period. Look for traffic quality changes, not just conversion percentage.
Problem: High Traffic, Low Conversion
This means: Your SEO and main image are working (people click), but your listing content fails to convince.
Focus on:
- Bullet points clarity and benefit emphasis
- Review quality and quantity (trust issues)
- Price-value perception alignment
- Q&A section completeness
- Competitor comparison (are you clearly better?)
Problem: Low Traffic AND Low Conversion
This means: Multiple issues compounding. You’re invisible AND unconvincing.
Priority order:
- Fix main image and title first (get more clicks)
- Then optimize listing content (convert the traffic)
- Don’t waste time on advanced tactics until basics work
Pro Tip: You can’t optimize conversion if you don’t have traffic. Focus on visibility first (ranking, PPC) to generate enough sessions for meaningful conversion data.
Problem: Conversion Varies Wildly Day-to-Day
This indicates: Small sample size issues or promotional inconsistency.
Solutions:
- Look at weekly rolling averages instead of daily
- Increase traffic through PPC to stabilize data
- Check for pricing/promotional changes causing variance
- Ensure consistent inventory levels (stockouts kill conversion)
Measuring ROI on Conversion Optimization Efforts
Let’s talk money. How do you know if optimization efforts paid off?
The Conversion ROI Formula
ROI = [(New Revenue – Old Revenue – Optimization Costs) / Optimization Costs] × 100
Example calculation:
- Old performance: 100 sessions/day × 10% CVR = 10 sales/day × $30 = $300/day = $9,000/month
- New performance: 120 sessions/day × 15% CVR = 18 sales/day × $30 = $540/day = $16,200/month
- Optimization costs: $800 (photography) + $200 (tools) = $1,000
- ROI: [($16,200 – $9,000 – $1,000) / $1,000] × 100 = 620% ROI
Break-Even Analysis
Most conversion optimizations pay for themselves within 7-30 days. Calculate your break-even point:
Break-even days = Optimization Cost / (Daily Revenue Increase)
Using the example above: $1,000 / ($540 – $300) = 4.2 days to break even.
Pro Tip: Track not just immediate conversion improvement but also the ranking benefits that compound over time. Better conversion → better rankings → more organic traffic → even more sales.
Final Thoughts: Conversion Is Your Competitive Moat
Here’s the ultimate truth about Amazon success in 2025: conversion rate is the only sustainable competitive advantage.
Products can be copied. Prices can be undercut. Keywords can be outbid. But a conversion-optimized listing? That requires skill, testing, and customer understanding that can’t be easily replicated.
When your conversion rate is 20% while competitors average 10%, you can:
- Afford higher PPC bids (2x conversion = 2x profitability per click)
- Rank organically faster (algorithm rewards converters)
- Weather price wars (less dependent on discounting)
- Build brand equity (quality perception compounds)
- Scale profitably (margins support growth)
Stop chasing tactics. Start building systems.
Your conversion optimization system should include:
- Monthly listing audits
- Quarterly competitive analysis
- Continuous review monitoring and response
- Systematic A/B testing protocols
- Conversion tracking dashboards
- Customer feedback loops
The sellers who build these systems don’t just succeed—they dominate.
Your competitors are reading the same articles, watching the same YouTube videos, and using the same tools. The difference between you and them?
Execution.
You now have the complete playbook for Amazon conversion rate optimization. Everything in this guide has been tested, proven, and replicated across thousands of listings.
The question isn’t whether these tactics work. The question is: will you actually implement them?
Start today. Pick ONE tactic from this guide—probably main image optimization—and execute it this week. Then move to the next.
Three months from now, when your conversion rate has doubled and your sales have skyrocketed, remember: you were one decision away from breakthrough results.
Make that decision now.
Frequently Asked Questions (FAQs)
What is a good Amazon conversion rate?
A good Amazon conversion rate varies by category but generally falls between 10-15%. However, top performers achieve 20-30%+ conversion rates. For high-ticket items ($100+), 8-12% is solid. For impulse purchases and consumables, aim for 15-25%. Your conversion rate is “good” if it’s above your category average and consistently improving through optimization efforts.
How do I find my Amazon conversion rate?
Navigate to Seller Central → Reports → Business Reports → Detail Page Sales and Traffic. Look for “Unit Session Percentage” which is Amazon’s term for conversion rate. This shows the percentage of visitors who purchased your product. Track this metric daily, weekly, and monthly to identify trends and measure optimization impact.
Why is my Amazon conversion rate so low?
Low conversion rates typically stem from seven core issues: poor quality images, misaligned pricing, unclear value proposition, insufficient reviews, unanswered customer questions, wrong keyword targeting, or superior competitor listings. Start by comparing your listing to top 3 competitors in your category. Identify obvious gaps in image quality, review quantity, or content clarity—these are usually your biggest opportunities.
How can I increase my Amazon conversion rate quickly?
The fastest conversion improvements come from image optimization—specifically your main image. Ensure it fills 85-95% of the frame, has professional lighting, and clearly shows your product. Secondary quick wins include: adding video content (can boost conversion 80%), rewriting bullets to emphasize benefits over features, responding to all Q&A questions, and implementing strategic pricing adjustments. Most sellers see 15-30% improvement within 2-4 weeks.
What is Unit Session Percentage on Amazon?
Unit Session Percentage (USP) is Amazon’s conversion metric showing what percentage of sessions result in units ordered. Unlike traditional conversion rate, USP can exceed 100% if customers buy multiple units in one session (buying 3 items = 300% USP). This metric appears in your Business Reports under Detail Page Sales and Traffic. It’s your primary indicator of listing performance effectiveness.
Does Amazon conversion rate affect ranking?
Yes, significantly. Amazon conversion rate is one of the top 3 ranking factors in the A9 algorithm. Higher conversion signals to Amazon that customers want your product, leading to better organic rankings. This creates a virtuous cycle: better conversion → improved rankings → more organic traffic → even more sales → further ranking improvements. Products with 20% conversion can outrank competitors with 10% conversion even if other factors are equal.
How do reviews impact Amazon conversion rate?
Reviews dramatically impact conversion. Products with fewer than 15 reviews struggle to convert above 8-10% regardless of quality. The impact plateaus around 50-100 reviews, where conversion improvement slows. A 4.5-star rating with 100 reviews typically converts 2-3x better than a 4.8-star product with 8 reviews. Both review quantity (trust through volume) and quality (4.3+ stars minimum) matter for optimal conversion.
What is the average conversion rate for Amazon FBA sellers?
The average Amazon FBA conversion rate is approximately 10-15% across all categories, though this varies significantly by product type, price point, and competition level. FBA sellers typically convert 15-25% better than FBM (Fulfilled by Merchant) sellers due to Prime eligibility, faster shipping, and increased trust. Top-performing FBA sellers in competitive categories achieve 20-30% conversion through aggressive optimization.
How does pricing affect Amazon conversion rate?
Pricing impacts conversion through perceived value, not just absolute cost. Products priced 10-20% below similar competitors often see conversion lifts, but pricing too low (40%+ below market) can actually hurt conversion by signaling low quality. The sweet spot balances competitive positioning with value perception. Test prices in $1-2 increments to find your optimal conversion price point, which maximizes total profit (price × margin × conversion × volume).
Should I use coupons to improve conversion rate?
Yes, strategically. Coupons visible in search results increase click-through AND conversion rates by signaling value before visitors even reach your listing. A 10-15% coupon typically improves conversion 20-40% while only reducing revenue 10-15%, creating net profit gains. However, constant discounting trains customers to wait for deals. Use coupons tactically during launches, seasonal peaks, or to combat temporary conversion drops—not permanently.
How long does it take to see conversion rate improvements?
Most optimization changes show measurable impact within 7-14 days, though you need 2-4 weeks of data for statistical significance. Image improvements often show results fastest (3-7 days). Copy changes take 10-14 days as the algorithm processes engagement signals. Pricing tests need 14-21 days to account for various traffic patterns. Review accumulation impacts conversion gradually over 30-90 days. Always allow adequate time before judging effectiveness.
What is A/B testing for Amazon listings?
A/B testing (split testing) involves changing one listing element at a time to measure conversion impact. Amazon offers “Manage Your Experiments” for Brand Registry sellers to test images and A+ content officially. For manual testing, change one variable (e.g., main image), track conversion for 2-4 weeks, then compare to baseline. Only test one element at a time or you won’t know what caused the change. Document everything in a testing log.
How does mobile optimization affect conversion?
Critical impact. Over 70% of Amazon traffic comes from mobile devices, where text readability, image clarity, and information hierarchy differ from desktop. Listings optimized for desktop often have 30-50% lower conversion on mobile. Mobile optimization tactics include: 72pt+ font in infographics, simplified bullet structure, front-loaded key benefits, and mobile-first image testing. Always preview your listing on an actual phone before publishing.
Can I improve conversion without changing my product?
Absolutely. Conversion optimization is primarily about presentation and persuasion, not product quality. The same exact product can convert at 8% with poor listing optimization or 24% with exceptional presentation. Focus on: professional photography, benefit-driven copy, comprehensive A+ content, strategic pricing, review generation, and Q&A management. These elements are entirely within your control regardless of product specifications.
What role does A+ Content play in conversion?
A+ Content (Enhanced Brand Content) typically improves conversion 5-10% by providing additional visual storytelling and detailed information after the bullet points. It catches buyers at the “interested but not convinced” stage and provides reasons to purchase through lifestyle imagery, comparison charts, brand story, and feature deep-dives. A+ content is mandatory for competitive categories and essential for products with complex features or differentiation.
How do I optimize conversion for new products with no reviews?
New products face the “cold start” challenge. Strategies: Amazon Vine Program (if Brand Registered) for initial reviews, aggressive “Request a Review” campaigns, exceptional product quality ensuring organic reviews, early bird discounts to drive initial sales velocity, and extra emphasis on professional images and content (compensating for review gap). Many sellers also use PPC heavily during launch to drive conversions that generate reviews organically. Target 15-25 reviews within first 30 days.
Does Amazon conversion rate vary by season?
Yes, significantly. Q4 holiday season (Oct-Dec) typically sees 20-40% higher conversion due to gift-buying urgency and reduced price sensitivity. Prime Day and Black Friday can 2-3x baseline conversion with proper optimization. Post-holiday (Jan-Feb) often sees 10-20% lower conversion as budgets tighten. Summer months vary by category (seasonal products surge, others slow). Adjust your optimization strategy and expectations based on seasonal patterns in your specific category.
What is the relationship between conversion rate and sales velocity?
Conversion rate and sales velocity are directly linked: Velocity = Traffic × Conversion Rate. Doubling your conversion rate doubles your sales velocity with the same traffic. High sales velocity improves Amazon rankings, which increases organic traffic, which further boosts velocity—creating a compounding growth effect. This is why conversion optimization often delivers exponential rather than linear results over 60-90 days.
How do I optimize conversion for high-ticket Amazon products?
High-ticket items (\$100+) require specialized conversion tactics: exceptionally detailed photography showing quality, comprehensive specifications for research-oriented buyers, prominent warranty/guarantee messaging to reduce purchase anxiety, video demonstrations proving value, professional A+ content establishing brand credibility, and customer service emphasis (phone support, technical assistance). Accept that high-ticket conversion rates will be 30-50% lower than category average due to longer consideration periods, but focus on customer lifetime value.
What tools help track and improve Amazon conversion rates?
Essential tools: Amazon Business Reports (free, native conversion tracking), Helium 10 (competitor analysis and optimization suggestions), Jungle Scout (sales and conversion estimates), SellerLabs (A/B testing platform), and Keepa (price history correlation with conversion). Start with free Amazon native tools—they provide 90% of necessary data. Upgrade to paid tools only when doing $10K+/month and need advanced competitor intelligence or automated testing capabilities.
Additional Resources for Conversion Excellence
Official Amazon Resources:
- Amazon Seller University – Free conversion optimization training
- Amazon Advertising Best Practices – PPC and conversion correlation
- Brand Registry Benefits – Unlock A+ Content and testing tools
Optimization Tools:
- Helium 10 – Comprehensive listing optimization suite
- Jungle Scout – Product research and conversion tracking
- Sellics – Profit optimization with conversion insights
Further Learning:
- Complete Amazon SEO Guide – How conversion fits into overall strategy
- Amazon Seller Central Blog – Official updates and best practices
- My Amazon Guy YouTube – Advanced optimization tactics
Ready to dominate your category? Conversion optimization isn’t a one-time project—it’s a competitive advantage you build systematically. Start with your biggest conversion gap today, implement the tactics from this guide, and watch your sales transform. Your competitors are comfortable with mediocre conversion rates. You won’t be.
For comprehensive understanding of how conversion optimization integrates with ranking, velocity, and overall Amazon success, explore the complete Amazon SEO ecosystem. Master the full system, dominate your market.