
Your product finally hit page 1. Sales are flowing. Everything’s perfect… until it’s not.
One morning you wake up to find your listings suppressed, your Buy Box gone, and a terrifying email from Amazon: “Your account health requires immediate attention.” Your rankings? Vanished. Your revenue? Flatlined.
Here’s the brutal reality: Amazon account health isn’t just about avoiding suspension—it’s directly tied to your search rankings, Buy Box eligibility, and visibility. Amazon’s algorithm doesn’t just reward great products and keywords. It punishes sellers with poor performance metrics by quietly throttling their traffic and burying their listings.
I’ve seen sellers spend thousands optimizing listings, only to watch rankings crater because they ignored a 2.5% Order Defect Rate or let their IPI score slip to 350. One bad week of performance can undo months of SEO work.
The scary part? Most sellers don’t realize they have a problem until it’s too late. Amazon’s account performance metrics operate like a silent ranking factor—invisible until they destroy you.
But here’s the good news: account health is completely within your control. Unlike reviews (which customers determine) or competitors (who you can’t control), your performance metrics are 100% manageable with the right systems.
This guide will show you exactly how to monitor, maintain, and optimize every critical metric that protects your rankings and keeps your account bulletproof.
Let’s make sure your success doesn’t get sabotaged by preventable performance issues.
Table of Contents
ToggleWhat Is Amazon Account Health and Why Does It Secretly Control Your Rankings?
Let’s start with what Amazon doesn’t explicitly tell you.
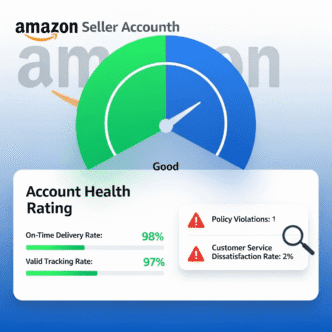
Amazon account health is your seller performance scorecard across multiple metrics that Amazon tracks 24/7. It includes everything from how fast you ship to how many defects your orders have to how well you manage inventory.
Here’s the part most sellers miss: poor account health doesn’t just risk suspension—it actively suppresses your organic rankings.
The Hidden Ranking Connection
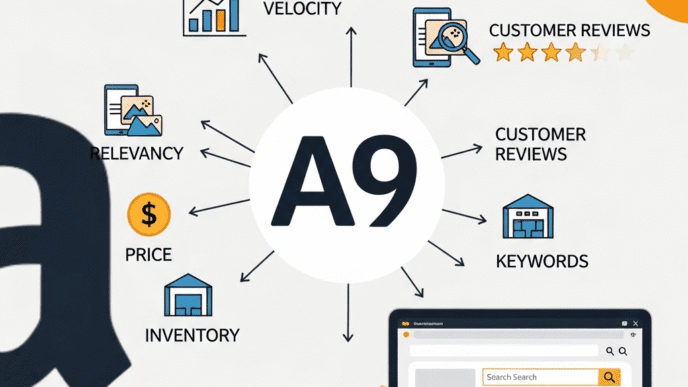
Amazon’s A10 algorithm evaluates seller reliability as a ranking factor. The logic is simple: why would Amazon show unreliable sellers to customers when reliable competitors exist?
How poor account health kills rankings:
Lower search visibility – Amazon algorithmically reduces impressions for poor performers Buy Box suppression – You lose Buy Box eligibility even at competitive prices Traffic throttling – Even if you rank, Amazon shows your listing to fewer searchers Promotional restrictions – Can’t run Lightning Deals or coupons Advertising penalties – Higher ACoS and reduced ad placement quality
A study by Amazon seller analytics firm DataHawk found that sellers with “Poor” or “At Risk” account health saw an average 34% drop in organic traffic even when keyword rankings appeared stable in tracking tools.
Translation: Your rank checker says you’re position 5, but Amazon is only showing your listing to a fraction of searchers at that position.
The Account Health Tiers
Amazon categorizes seller performance into tiers:
Healthy (Green) – All metrics within targets, full benefits At Risk (Yellow) – One or more metrics approaching thresholds, warnings issued Critical (Red) – Metrics exceed thresholds, account restrictions or suspension imminent Suspended – Account deactivated, no selling privileges
Pro Tip: Never let yourself reach “At Risk” status. Once you hit yellow, Amazon’s algorithm has already started penalizing you. Maintain “Healthy” status at all costs—it’s not just about avoiding suspension, it’s about protecting your traffic.
Where to Find Your Account Health Dashboard
Navigate to: Seller Central → Performance → Account Health
This dashboard shows your real-time status across all critical metrics. Check it weekly minimum, daily if you’re scaling fast or have had recent issues.
For comprehensive context on how account health integrates with your overall Amazon strategy, check out this complete Amazon SEO guide.
What Are the Critical Amazon Account Performance Metrics You Must Monitor?
Amazon tracks dozens of metrics, but these are the make-or-break ones that affect rankings and suspension risk.
The Big 3: Metrics That Trigger Account Suspension
These three metrics have hard thresholds. Exceed them and suspension is virtually guaranteed:
1. Order Defect Rate (ODR)
- Threshold: Must stay below 1%
- Calculation: (Negative feedback + A-to-z claims + Chargebacks) / Total orders
- Why it matters: Measures customer dissatisfaction with order experience
2. Pre-Fulfillment Cancel Rate
- Threshold: Must stay below 2.5%
- Calculation: Seller-canceled orders / Total orders
- Why it matters: Signals inventory management problems or listing inaccuracies
3. Late Shipment Rate
- Threshold: Must stay below 4%
- Calculation: Orders shipped after expected ship date / Total orders
- Why it matters: Directly impacts customer experience and trust
Pro Tip: These thresholds aren’t goals—they’re emergency brakes. Target 0.5% ODR, 1% cancel rate, and 2% late shipment rate to maintain healthy buffer zones. Operating near thresholds is playing with fire.
Critical Metrics Comparison Table
| Metric | Amazon Threshold | Recommended Target | Primary Impact | Measurement Period |
|---|---|---|---|---|
| Order Defect Rate | < 1% | < 0.5% | Suspension risk, rankings | Rolling 60 days |
| Pre-Fulfillment Cancel | < 2.5% | < 1% | Suspension risk, Buy Box | Rolling 7 days |
| Late Shipment Rate | < 4% | < 2% | Suspension risk, Buy Box | Rolling 10 & 30 days |
| Valid Tracking Rate | > 95% | > 98% | Customer experience, rankings | Rolling 30 days |
| On-Time Delivery | N/A | > 97% | Buy Box eligibility | Rolling 10 & 30 days |
| Return Dissatisfaction Rate | < 10% | < 5% | Customer experience | Rolling 60 days |
The IPI Score: Your Inventory Performance Rating
Inventory Performance Index (IPI) is Amazon’s score (0-1000) measuring how efficiently you manage FBA inventory.
IPI Score thresholds:
- 400+ – Ideal, no restrictions
- 350-399 – Okay, but watch it
- Below 350 – Storage limits imposed, overage fees, restock restrictions
What affects IPI score:
- Excess inventory (aged 90+ days)
- Sell-through rate
- Stranded inventory (listing issues)
- In-stock rate (avoiding stockouts)
Poor IPI doesn’t directly suspend your account, but it crushes profitability through storage fees and limits your ability to restock winners—indirectly killing your rankings.
Customer Service Performance Metrics
Contact Response Time
- Target: Respond within 24 hours
- Impact: Customer trust, potential for negative feedback
Customer Service Dissatisfaction Rate
- Target: < 25%
- Impact: Account health rating, Amazon may restrict selling privileges
Pro Tip: Enable vacation mode before holidays or when you can’t monitor messages for 24+ hours. Unanswered messages hurt your metrics and give Amazon reason to penalize you.
Valid Tracking Rate: The Metric Sellers Ignore
Valid Tracking Rate measures the percentage of shipments with valid, Amazon-approved tracking.
Why it matters: Without valid tracking, customers can’t track orders, leading to “Where is my stuff?” messages and potential A-to-z claims.
Target: 95% minimum (aim for 98%+)
Common causes of poor tracking:
- Using non-integrated carriers
- Manual tracking uploads that fail
- Cancelled labels still counted in system
- Tracking numbers that never scan
If your valid tracking rate drops below 95%, Amazon can remove your seller-fulfilled shipping options, forcing you to use Amazon shipping programs or FBA only.
How to Improve Amazon Seller Account Health: Metric-by-Metric Strategies
Let’s tackle each critical metric with actionable improvement strategies.
Fixing High Order Defect Rate (ODR Management)
Order Defect Rate is your most dangerous metric because it combines three customer dissatisfaction signals.
ODR Components breakdown:
Negative Feedback (1-2 star reviews):
- Proactively request feedback removal for product issues (not seller fault)
- Provide exceptional customer service to prevent negative feedback
- Address issues before customers escalate to feedback
A-to-z Guarantee Claims:
- Respond to customer messages within 12 hours
- Resolve issues before customers file claims
- Maintain clear, accurate product descriptions to prevent disappointment
Chargebacks:
- Usually payment/fraud issues
- Verify addresses for high-value orders
- Use address validation tools
ODR reduction tactics:
- Proactive communication – Message buyers after purchase with helpful info
- Quality control – Inspect products before shipping (FBM sellers)
- Fast refunds – Issue refunds immediately when warranted
- Pre-emptive replacement – Offer replacement before customer complains
- Feedback removal – Request removal for violating Amazon’s feedback guidelines
Real example: A supplement seller had 1.2% ODR (dangerously close to suspension). They implemented a “zero-friction refund” policy—any customer complaint got instant refund, no questions. ODR dropped to 0.4% within 30 days. Cost of refunds: $340. Value of keeping account active: priceless.
Reducing Pre-Fulfillment Cancel Rate
High cancellation rates signal to Amazon that you’re listing products you can’t actually fulfill.
Common causes:
- Out of stock inventory you didn’t notice
- Pricing errors attracting orders you can’t profitably fulfill
- Inventory sync issues between multiple sales channels
- Fraudulent order concerns
Prevention strategies:
1. Real-time inventory management
- Use inventory management software that syncs across channels
- Set buffer stock (reserve 5-10 units to prevent overselling)
- Enable low-stock alerts
2. Automated repricing guardrails
- Set minimum profitable prices in repricing tools
- Avoid race-to-bottom pricing that forces cancellations
3. Fraud detection systems
- Cancel fraudulent orders within 1 hour (doesn’t count toward cancel rate if within first hour)
- Use address verification services
- Watch for red flags (new account, expedited shipping, high-value order)
4. Honest listing management
- Don’t list products you don’t have in stock
- Use “pre-order” listings for upcoming stock
- Close listings immediately when inventory depletes
Pro Tip: If you must cancel an order, do it within the first hour and Amazon doesn’t count it toward your cancel rate. Set up systems to catch problems immediately, not days later.
Improving Late Shipment Rate
Late shipment rate is entirely preventable with proper systems.
Root causes analysis:
For FBM sellers:
- Inadequate handling time settings (1-day handling when you need 2)
- Weekend/holiday order processing delays
- Carrier pickup schedule misalignment
- Manual shipping process bottlenecks
For FBA sellers:
- Shouldn’t have late shipment issues (Amazon fulfills)
- If you do, it’s usually stranded inventory or listing errors
LSR optimization tactics:
1. Conservative handling time
- Set handling time with buffer (2-day handling even if you can do 1-day)
- Account for weekends and holidays
- Don’t overpromise delivery speed
2. Same-day ship cutoff
- Set clear internal cutoff (e.g., orders by 2 PM ship same day)
- Communicate this to team if you have staff
- Use afternoon batch shipping rather than end-of-day scrambles
3. Automated shipping workflows
- Integrate marketplace with shipping software
- Auto-purchase labels when orders arrive
- Schedule daily carrier pickups
4. Backup shipping options
- Have multiple carriers available
- Keep backup label printers
- Know location of after-hours drop-off points
5. Vacation mode for absences
- Enable vacation mode rather than letting orders go late
- Better to pause than to tank your LSR
Pro Tip: Use Amazon Buy Shipping services whenever possible. Amazon-purchased labels integrate seamlessly, reducing tracking upload errors and ensuring valid tracking rates.
Valid Tracking Rate Optimization
This metric is often overlooked until it becomes a problem.
Tracking validation checklist:
✓ Use integrated carriers
- USPS, UPS, FedEx through Amazon Buy Shipping
- ShipStation, ShippingEasy, or similar integrated solutions
- Avoid manual tracking number entry
✓ Upload tracking within 2 days of order
- Don’t wait until delivery confirmation
- Upload immediately after label purchase
- Automated systems handle this seamlessly
✓ Verify tracking accuracy
- Check that tracking numbers actually work
- Confirm tracking updates are appearing
- Monitor for “tracking not found” errors
✓ Handle cancellations properly
- If you cancel a shipped order, update Amazon immediately
- Don’t leave ghost tracking numbers in system
Common tracking failures:
Regional carrier issues: Using regional carriers not recognized by Amazon Manual entry errors: Typos in tracking numbers Delayed scans: Packages not scanned by carrier for days Wrong carrier selection: Selecting USPS when using FedEx, etc.
Fix: Stick with major carriers through Amazon’s integrated shipping. It’s foolproof.
Maintaining Good Amazon Seller Performance Score: Prevention Systems
The best way to fix account health issues is to never have them in the first place.
Building Your Account Health Monitoring System
Daily monitoring (5 minutes):
- Check Account Health dashboard
- Review overnight orders for potential issues
- Scan customer messages for problems brewing
Weekly review (30 minutes):
- Analyze metric trends (improving or degrading?)
- Review negative feedback and plan responses
- Check inventory levels and restock needs
- Audit IPI score components
Monthly deep dive (2 hours):
- Complete account health audit
- Review all returns and reasons
- Analyze defect patterns (specific products causing issues?)
- Update SOPs based on learnings
Pro Tip: Create a simple spreadsheet or use tools like SellerLegend or HelloProfit to track your metrics over time. Trends matter more than single data points. A metric trending toward thresholds requires immediate intervention.
The Early Warning System
Set up alerts before metrics reach critical levels:
Alert thresholds to implement:
- ODR reaches 0.7% (warning, you’re at 70% of suspension threshold)
- Cancel rate reaches 1.5% (60% of threshold)
- Late shipment rate reaches 3% (75% of threshold)
- IPI score drops below 400
- Any new A-to-z claim filed
- Any negative feedback received
How to set up alerts:
- Amazon’s native email notifications (limited)
- Third-party tools like Seller Labs, FeedbackWhiz, or SellerLegend
- Custom Google Sheets + Zapier integrations
- Daily dashboard review ritual
Don’t wait for Amazon’s warnings—they come too late. Build your own early warning system.
Standard Operating Procedures (SOPs) for Performance
Document your processes:
Order Processing SOP:
- Order received → auto-notification
- Pick/pack within 4 hours (same-day cutoff: 2 PM)
- Ship by end of business day
- Upload tracking immediately
- Send tracking info to customer
Customer Service SOP:
- Respond to all messages within 12 hours (target: 4 hours)
- Offer solutions immediately (refund/replacement)
- Never argue or debate with customer
- Document all interactions
- Follow up after resolution
Quality Control SOP:
- Inspect every item before shipping
- Check for damage, missing components
- Verify SKU matches order
- Use quality packaging materials
- Include thank-you note with return/exchange info
Pro Tip: Your SOPs should be so detailed that a new employee could execute them perfectly without asking questions. If you’re a solo seller, SOPs ensure you don’t skip steps when you’re busy or tired.
Amazon IPI Score Improvement Strategies: Mastering Inventory Performance
Your IPI score affects profitability more than suspension risk, but poor IPI indirectly kills rankings by preventing restocks of winning products.
Understanding IPI Score Components
Amazon calculates IPI based on four factors:
1. Excess Inventory (Most Important)
- Items with 90+ days of supply based on sales velocity
- Impact: Major negative factor
- Fix: Liquidate slow movers, adjust reorder quantities
2. Sell-Through Rate
- Units sold ÷ average units available over 90 days
- Target: 10% minimum (higher is better)
- Impact: Moderate factor
- Fix: Improve conversion, run promotions, optimize listings
3. Stranded Inventory
- FBA inventory without active listing
- Impact: Moderate factor
- Fix: Fix listing errors immediately, suppress outdated SKUs
4. In-Stock Rate
- Percentage of time your best sellers have stock
- Target: 80%+ (90%+ ideal)
- Impact: Moderate factor
- Fix: Improve forecasting, reduce lead times
IPI Score Optimization Tactics
If your IPI is below 400, prioritize these actions:
Immediate (Week 1):
- Fix all stranded inventory (easiest quick win)
- Create removal orders for dead inventory
- Run Lightning Deals on slow movers
- Lower prices on excess inventory to accelerate sales
Short-term (Weeks 2-4):
- Improve sell-through on top 80% of SKUs
- Don’t restock bottom 20% performers until IPI recovers
- Use FBA inventory reports to identify problem SKUs
- Set up automatic reorder points to prevent stockouts
Long-term (Ongoing):
- Implement demand forecasting tools
- Use inventory management software (RestockPro, SoStocked)
- Establish reorder formulas based on velocity
- Monitor IPI weekly and adjust purchasing
Real case study: An electronics seller had IPI of 340, facing storage limits during Q4 (disaster timing). They:
- Removed 800 units of dead inventory ($400 removal cost)
- Ran 30% off deals on 6 slow SKUs (sold through in 2 weeks)
- Fixed 12 stranded listings
- Paused reorders on bottom performers
IPI jumped to 425 within 3 weeks, storage limits lifted, Q4 restocking proceeded normally.
Cost of action: $1,200 (removals + deep discounts) Cost of inaction: Missing entire Q4 season = $50K+ in lost revenue
Avoiding the IPI Death Spiral
The death spiral happens when:
- Low IPI triggers storage limits
- Can’t restock winning products
- Sales velocity drops
- Sell-through rate worsens
- IPI drops further
- Cycle continues
Breaking the spiral:
- Aggressively liquidate non-performers (even at a loss)
- Focus all resources on top 10-20% of SKUs
- Use seller-fulfilled prime or FBM temporarily
- Sacrifice breadth for depth until IPI recovers
Pro Tip: If your IPI drops below 350, immediately stop sending inventory for bottom 50% of SKUs. Focus exclusively on restocking your proven winners. Breadth of catalog matters far less than having your bestsellers in stock.
Protecting Amazon Seller Account from Suspension: Crisis Management
Sometimes despite best efforts, metrics slip into danger zones. Here’s how to respond.
The Account Health Emergency Protocol
When you hit “At Risk” or “Critical” status:
Step 1: Immediate Damage Control (Within 24 hours)
- Identify which metric(s) triggered the warning
- Calculate how many “clean” orders needed to recover
- Pause PPC and promotions if order volume might worsen metrics
- Enable vacation mode if necessary to stop order flow
Step 2: Root Cause Analysis (Day 2-3)
- Review every defect, cancellation, or late shipment from past 60 days
- Identify patterns (specific product? Carrier? Time period?)
- Determine if issue is systemic or anomaly
- Document findings in detail
Step 3: Corrective Action Plan (Day 4-5)
- Write detailed Plan of Action (POA) even if not yet suspended
- Outline specific steps to prevent recurrence
- Implement process changes immediately
- Create evidence of changes (updated SOPs, new tools, training docs)
Step 4: Metric Recovery (Ongoing)
- Monitor metrics daily
- Celebrate every clean order (dilutes bad metric %)
- Request removal of unfair feedback/claims when applicable
- Consider FBA for consistency if you’re FBM
Pro Tip: Don’t wait for Amazon to demand a Plan of Action. Write one proactively when you hit “At Risk” status and implement it immediately. If suspension comes, you’ll already have a detailed POA ready to submit.
Writing an Effective Plan of Action (POA)
If suspended, your POA is your only lifeline. Amazon reviewers see hundreds daily—make yours stand out.
POA structure that works:
1. Root Cause (Be specific, take responsibility)
- Don’t blame customers, Amazon, or carriers
- Identify exact systemic failure
- Show you understand the problem
Example: ❌ “Customers were unreasonable and left unfair feedback” ✅ “Our quality control process failed to catch damaged inventory before shipment, resulting in customer dissatisfaction”
2. Immediate Corrective Actions (What you’ve done)
- List specific actions already taken
- Include dates and details
- Provide evidence (screenshots, invoices, training docs)
Example: “We immediately implemented:
- New 3-point QC inspection checklist (attached)
- Hired QC specialist (offer letter attached dated [date])
- Replaced all packaging materials with crush-resistant boxes (invoice attached)”
3. Preventative Measures (How you’ll never repeat)
- Detail ongoing systems and processes
- Show this is sustainable, not temporary
- Demonstrate you’ve addressed root cause, not just symptoms
Example: “Ongoing prevention:
- Daily QC audits with photographic documentation
- Weekly supplier quality reviews
- Monthly staff training on inspection standards
- Quarterly process reviews to identify improvement opportunities”
POA mistakes that get you denied:
❌ Generic templates clearly copied from internet
❌ Blaming external factors beyond your control
❌ Vague promises without specific actions
❌ Defensive or argumentative tone
❌ No evidence of implementation
❌ Focusing on how suspension hurts you (Amazon doesn’t care)
Pro Tip: Write your POA as if you’re explaining the situation to a friend who’s smart but doesn’t know Amazon. Clear, specific, honest, and focused on solutions. Amazon’s review team appreciates straightforward accountability over corporate jargon.
Account Health Rating Impact on Buy Box and Rankings
Let’s connect the dots between metrics and actual business impact.
How Poor Account Health Destroys Buy Box Eligibility
The Amazon Buy Box algorithm considers seller performance heavily:
Buy Box factors influenced by account health:
- Order Defect Rate (weight: very high)
- Late Shipment Rate (weight: high)
- Valid Tracking Rate (weight: medium)
- Customer service metrics (weight: medium)
- Seller rating/feedback (weight: medium)
The Buy Box penalty cascade:
Healthy account (ODR <0.5%, LSR <2%): 100% of Buy Box share when competitive At Risk account (ODR 0.8%, LSR 3%): 60-70% Buy Box share, losing to worse-priced competitors Critical account (ODR >1%, LSR >4%): 0-20% Buy Box share, essentially invisible
Real impact: A kitchen products seller with 4.2% late shipment rate maintained position 3 ranking but lost Buy Box to a position 8 competitor priced $2 higher. Their sales dropped 65% despite “good” ranking.
Fix: They switched to FBA for top 10 SKUs, LSR dropped to 0.5%, Buy Box recovered within a week, sales returned to normal.
The Ranking Suppression You Can’t See
This is the insidious part: Amazon doesn’t always change your keyword ranking position, but they reduce how often your listing appears at that position.
How impression throttling works:
Scenario: You rank position 5 for “yoga mat”
- Healthy account: Your listing shows 100% of the time at position 5
- At Risk account: Your listing shows 60-70% of the time, competitors rotate in
- Critical account: Your listing shows 20-40% of the time
Your rank tracking tool still reports position 5, but your traffic is cut by 50%+.
How to detect throttling:
- Compare keyword rankings to actual traffic sources in Business Reports
- Calculate impression share vs expected impression share
- Notice traffic declining despite stable rankings
The only fix: Improve account health. There’s no hack or workaround. Amazon reduces visibility for poor performers, period.
Tools for Monitoring and Managing Account Health
Don’t manage account health manually—use tools to automate monitoring and alerts.
Account Health Tool Comparison
| Tool | Monthly Cost | Best Feature | Ideal For |
|---|---|---|---|
| Amazon Seller Central | Free | Official metrics, most accurate | All sellers (baseline) |
| FeedbackWhiz | $20-100 | Automated feedback/review requests | Feedback management |
| Seller Legend | $47-197 | Comprehensive analytics dashboard | Data-driven sellers |
| Hello Profit | $97 | P&L + performance tracking | Financial + performance |
| ManageByStats | $29-199 | Email automation + alerts | Customer service automation |
| Seller Labs | $67-497 | All-in-one (ads + performance) | Larger sellers |
| RestockPro | $79-399 | IPI optimization + forecasting | Inventory-heavy sellers |
Essential Tool Stack by Seller Size
Beginner (<$10K/month):
- Amazon Seller Central (free)
- FeedbackWhiz ($20/mo) for review automation
- Google Sheets for manual tracking
Growth Stage ($10K-$100K/month):
- Seller Legend ($97/mo) for analytics
- FeedbackWhiz ($50/mo) for customer service
- RestockPro ($79/mo) if FBA heavy
Established ($100K+/month):
- Hello Profit or Seller Legend for comprehensive analytics
- ManageByStats for customer service automation
- RestockPro for inventory optimization
- Dedicated VA or team member monitoring account health daily
Pro Tip: Don’t over-tool. Start with Seller Central + one customer service tool (FeedbackWhiz or ManageByStats). Add complexity only when you have clear ROI justification.
Setting Up Your Monitoring Dashboard
Create a simple weekly scorecard:
Weekly Account Health Scorecard:
| Metric | Current | Target | Trend | Status |
|---|---|---|---|---|
| ODR | 0.42% | <0.5% | ⬇️ | 🟢 |
| Cancel Rate | 0.8% | <1% | ➡️ | 🟢 |
| LSR | 2.1% | <2% | ⬆️ | 🟡 |
| Valid Tracking | 97.8% | >98% | ⬇️ | 🟡 |
| IPI Score | 445 | >400 | ⬆️ | 🟢 |
| Customer Response | 8 hrs | <12 hrs | ➡️ | 🟢 |
🟢 = Healthy | 🟡 = Watch closely | 🔴 = Urgent action needed
Review this every Monday. Trends matter more than single data points.
For comprehensive understanding of how account health fits into your complete Amazon success strategy, explore this Amazon SEO ecosystem guide.
Advanced Account Health Strategies for Competitive Advantage
Once you’ve mastered the basics, these advanced tactics separate good sellers from great ones.
Using FBA as Account Health Insurance
FBA’s account health advantages:
Zero late shipments – Amazon handles fulfillment Perfect valid tracking – Integrated automatically Better customer service – Amazon handles most inquiries Returns management – Amazon processes returns
The hybrid strategy:
- Use FBA for high-velocity, consistent products
- Use FBM for oversized, low-velocity, or high-margin items where you can maintain perfect metrics
- Never use FBM if you can’t maintain <2% late shipment rate
Real example: A tools seller used FBM for everything, struggled with 3.5% late shipment rate. Switched top 20 SKUs (80% of volume) to FBA, kept long-tail on FBM with conservative shipping times. Overall late shipment rate dropped to 0.8%, Buy Box share increased from 55% to 92%, sales increased 67% despite FBA fees.
The Geographic Diversification Strategy
If you’re FBM, shipping times vary dramatically by destination.
Smart handling time settings:
- Set conservative default handling time (2-3 days)
- Use expedited shipping for distant zones to meet promises
- Consider regional fulfillment centers or 3PLs for consistent delivery
Avoiding late shipments through geography:
- Analyze where most orders come from
- Locate fulfillment near customer concentration
- Use multiple fulfillment locations if volume justifies
Proactive Feedback and Review Management
Don’t wait for problems—manage perception actively.
Feedback management best practices:
1. Automated request sequences
- Day 3 after delivery: Product satisfaction check
- Day 7: Request feedback/review
- Day 14: Final gentle reminder
2. Negative feedback intervention
- Monitor feedback daily
- Contact customer immediately when negative received
- Offer resolution before they escalate
- Request removal if violates Amazon guidelines
3. Feedback removal criteria (Amazon will remove):
- Contains profanity or obscene language
- Includes seller-identifying information (name, email)
- Entire comment is product review (not seller feedback)
- Relates to fulfillment (for FBA orders—Amazon’s responsibility)
Pro Tip: Amazon removes about 30-40% of feedback removal requests when properly documented. Always try. One removed negative feedback can be the difference between 0.9% ODR and 1.1% ODR (healthy vs suspended).
The Return Prevention System
Returns don’t directly affect account health, but they indirectly impact it through feedback and A-to-z claims.
Return prevention tactics:
1. Expectation management
- Accurate product descriptions and dimensions
- Multiple images showing scale and detail
- Clear size charts and fit guides (apparel)
- Video showing product in use
2. Quality control
- Inspect before shipping
- Use quality packaging
- Include clear instructions
- Ensure product matches listing exactly
3. Proactive customer service
- Include “how to use” card with product
- Provide easy-to-find customer service contact
- Respond to questions before they become returns
4. Strategic return policies
- Consider offering prepaid return labels (reduces negative feedback)
- Process refunds immediately (reduces A-to-z claims)
- Learn from return reasons to improve listings
Data point: Sellers who proactively offer return solutions before customers request them see 60% fewer A-to-z claims and 40% fewer negative feedbacks, according to FeedbackWhiz data.
Real-World Case Study: Account Health Recovery and Ranking Restoration
Let me walk you through a complete account health crisis and recovery.
The Crisis: Electronics Seller Facing Suspension
Starting situation (Week 0):
- Account status: Critical (red)
- ODR: 1.3% (above 1% threshold)
- Late shipment rate: 4.8% (above 4% threshold)
- Cancel rate: 1.1% (below threshold but elevated)
- Rankings: Dropped 30-50% across top keywords
- Buy Box: Lost on all products
- Daily sales: Dropped from 45 units/day to 12 units/day
- Suspension notice: 7 days to improve or account closed
Root causes identified:
ODR issues:
- Using cheap overseas supplier with 15% defect rate
- Packaging inadequate for fragile electronics
- Product descriptions didn’t match actual specs
Late shipment issues:
- One-day handling time was unrealistic
- Weekend orders weren’t processed until Monday
- Using slowest shipping option to save money
The Recovery Plan Implementation
Week 1: Emergency Actions
- Enabled vacation mode to stop new orders (prevent further damage)
- Switched top 5 SKUs to FBA immediately (air shipped inventory)
- Changed handling time to 2 days for remaining FBM products
- Upgraded all shipping to Priority Mail (faster, more reliable)
- Hired inspection service for remaining FBM inventory
- Contacted all recent customers with issues, offered refunds/replacements
Week 2-3: Process Overhaul
- Found new supplier with better QC (samples tested)
- Rewrote all product descriptions with accurate specs
- Upgraded packaging (custom foam inserts)
- Implemented weekend order processing
- Created detailed QC checklist
- Set up ShipStation for automated shipping
Week 4-6: Metric Recovery
- Executed ~200 “clean” orders with zero defects
- ODR diluted from 1.3% → 0.8% (back below threshold)
- LSR dropped from 4.8% → 1.9% (FBA + better FBM processes)
- Cancel rate improved to 0.6%
- Account status: Moved from Critical → At Risk → Healthy
Week 7-8: Ranking and Sales Recovery
- Buy Box eligibility restored
- Organic rankings began climbing back
- Daily sales: 12 → 28 → 41 units/day (returning to baseline)
- Submitted Plan of Action proactively (before required)
- Amazon acknowledged improvements, warnings removed
The Results After 60 Days
Account health metrics:
- ODR: 1.3% → 0.4% (67% improvement)
- Late shipment rate: 4.8% → 1.2% (75% improvement)
- Cancel rate: 1.1% → 0.5% (55% improvement)
- Account status: Healthy (green)
Business impact:
- Daily sales: 12 → 52 units/day (333% recovery + growth)
- Buy Box share: 0% → 88%
- Average keyword rankings: +22 positions recovered
- Monthly revenue: $9,600 → $46,800 (387% increase)
Investment required:
- FBA inventory shipment: $850
- New supplier samples and transition: $1,200
- Packaging improvements: $400
- ShipStation subscription: $59
- Inspection service: $300
- Total: $2,809
Return on investment: Break-even in 4 days, $44K+ additional profit over 60 days
Key Lessons from the Recovery
1. Speed matters – Waiting makes everything worse. Act within 24 hours of warnings.
2. FBA as emergency backup – Even if you prefer FBM, have FBA ready for crisis situations.
3. Clean orders dilute bad metrics – Math works in your favor if you can execute perfectly for 100+ orders.
4. Systemic fixes beat band-aids – New supplier + better processes > damage control.
5. Proactive communication – Writing POA before required showed Amazon serious commitment.
Pro Tip: The seller told me later that the crisis was the best thing that happened to his business. It forced operational improvements that would have taken years otherwise. Sometimes you need a near-death experience to build bulletproof systems.
How Account Health Affects Different Seller Types
Account health management varies significantly by seller model.
FBA Sellers: Different Challenges
FBA advantages:
- Amazon handles fulfillment (zero late shipments)
- Automatic valid tracking
- Amazon manages many customer service issues
FBA-specific account health focuses:
- IPI score – Your main concern
- Stranded inventory – Listing issues prevent sales
- Product quality – Defects still generate ODR
- Inventory planning – Stockouts hurt in-stock rate
FBA account health priorities:
- Maintain IPI above 400 (preferably 500+)
- Fix stranded inventory immediately
- Monitor product quality (supplier issues)
- Forecast accurately to prevent stockouts
FBM Sellers: Maximum Control, Maximum Risk
FBM challenges:
- You control everything (shipping, customer service)
- Higher risk of late shipments
- Manual tracking uploads
- Direct customer service responsibility
FBM account health priorities:
- Rock-solid shipping processes (must hit <2% late shipment)
- Valid tracking rate vigilance (>98%)
- Conservative handling times
- Fast customer service response (<12 hours)
- Quality control before shipping
FBM success requirements:
- Professional shipping software (ShipStation, ShippingEasy)
- Daily order processing schedule
- Backup shipping plans
- Weekend/holiday coverage strategy
Hybrid Sellers: Best of Both Worlds
Strategic hybrid approach:
Use FBA for:
- High-velocity products (daily sales)
- Small, lightweight items
- Products where Prime badge matters
- Items with thin margins (can’t afford late shipments)
Use FBM for:
- Oversized/heavy items (high FBA fees)
- Low-velocity long-tail
- High-margin products (can afford shipping attention)
- Customized or personalized items
Hybrid account health strategy:
- Let FBA handle bulk of volume (protects metrics)
- Maintain perfect FBM processes for remaining items
- Monitor blended metrics carefully
- Have FBA backup plan for FBM items if needed
Pro Tip: If your FBM late shipment rate ever exceeds 3%, immediately shift your top 10 SKUs to FBA temporarily. This protects your overall account health while you fix FBM processes. Better to pay FBA fees than lose your account.
Seasonal Account Health Challenges and Solutions
Account health management changes with seasons.
Q4 Holiday Season (Oct-Dec)
Unique challenges:
- Massive order volume increases error probability
- Carrier delays outside your control
- Customer expectations higher
- Returns spike in January
Q4 protection strategies:
1. Buffer handling times
- Add extra day to handling time in November
- Set realistic expectations vs promising speed
2. Premium shipping
- Use faster shipping methods during peak
- Cost of overnight vs cost of late shipments: no contest
3. FBA advantage
- Amazon handles peak surge professionally
- Consider temporary FBA for holiday season
4. Communication over-delivery
- Send tracking immediately
- Proactive delay notifications
- Over-communicate with customers
5. Temporary help
- Hire seasonal shipping assistants
- VA for customer service
- Don’t try to solo high season
Prime Day and Major Sales Events
Challenges:
- Sudden volume spikes
- Increased returns from impulse buyers
- Higher customer service volume
- Potential stockouts
Event preparation:
Pre-event (2 weeks before):
- Stock extra inventory
- Brief team/VAs on increased volume
- Test shipping workflows
- Set up auto-responses for common questions
During event:
- Monitor metrics hourly
- Have backup shipping supplies ready
- Respond to messages within 4 hours (not 24)
- Process orders same-day regardless of cutoff
Post-event:
- Handle returns graciously
- Request feedback quickly (while customers happy)
- Analyze performance for next event
Post-Holiday Slump (Jan-Feb)
Challenges:
- Return wave from holiday purchases
- Lower sales volume affects sell-through (IPI)
- Excess inventory aging
Recovery strategies:
- Run promotions to move excess inventory
- Don’t overreact to temporary metric blips
- Use slow period for process improvements
- Plan for next year’s peak
Pro Tip: Many sellers see ODR temporarily increase in January due to holiday return disappointment. Don’t panic if your ODR hits 0.8% in January—it’s seasonal. Focus on resolving issues quickly to prevent escalation to negative feedback or claims.
Advanced Metrics: Understanding What Amazon Doesn’t Explicitly Show
Beyond the obvious metrics, Amazon tracks hidden signals that affect your account.
The Customer Satisfaction Score (Invisible But Important)
Amazon internally rates every seller on overall customer satisfaction, combining:
- Feedback ratings
- Response time
- Resolution effectiveness
- Return rates
- Contact rate (customers contacting you about issues)
You can’t see this score directly, but you can infer it from:
- Your ability to win Buy Box vs competitors
- Whether Amazon invites you to programs (Vine, early access)
- How quickly Amazon responds to your support tickets
Improving invisible satisfaction scores:
- Resolve issues before customers contact you
- Proactive communication (shipment updates, delivery confirmations)
- Fast refunds when warranted
- Thank you notes and follow-up
- Excellent packaging experience
The Velocity Consistency Factor
Amazon notices when your account health suddenly changes—even if you stay within thresholds.
Patterns Amazon watches:
Sudden spikes:
- ODR jumps from 0.3% to 0.9% (still safe, but Amazon notices)
- Late shipment rate doubles week-over-week
- Cancel rate increases during high volume
Trend degradation:
- Metrics slowly creeping toward thresholds over months
- Seasonal patterns that suggest operational problems
Category-specific expectations:
- Electronics sellers held to higher standards (higher return rates accepted)
- Consumables expected to have lower ODR (repeat purchase model)
Pro Tip: Maintain consistency in your metrics. A consistent 0.5% ODR is better than bouncing between 0.2% and 0.8% monthly, even though the average is same. Stability signals operational maturity.
Expert Insights on Account Health Management
Let me share wisdom from experienced sellers and Amazon consultants.
“Account health is like your credit score—easy to damage, slow to rebuild. I’ve seen sellers lose six-figure businesses because they ignored a 1.2% ODR for two weeks. Prevention is 1000x easier than recovery.” – Chris McCabe, Former Amazon Investigator & ecommerce Chris Founder
“The sellers who succeed long-term treat account health as their #1 KPI—more important than sales, more important than profit. You can recover from a bad month of sales. You can’t sell anything with a suspended account.” – Norm Farrar, Amazon Consultant & Partner at Ecomcircles
“Most account health issues trace back to one thing: cutting corners to save money. Cheap suppliers, slow shipping, no quality control. The money you ‘save’ costs you 10x when your account health tanks.” – Shannon Roddy, Amazon Seller Coach
“I track my account health metrics daily in a simple spreadsheet. Takes 5 minutes. That daily habit has prevented at least three potential suspensions in five years by catching trends early.” – David Gonzalez, 7-Figure Amazon Seller
“Account health is the only truly fair ranking factor on Amazon. It’s 100% within your control. Reviews can be manipulated by competitors, keywords can be outbid, but your account health? That’s all you.” – Kevin King, Amazon Seller & Freedom Ticket Creator
The Future of Account Health: Upcoming Changes and Trends
Amazon constantly evolves account health requirements. Stay ahead.
AI-Powered Performance Monitoring
Amazon is implementing machine learning to predict account health issues before they become critical.
What’s coming:
- Predictive alerts: “Your current trajectory will hit ODR threshold in 12 days”
- Pattern recognition: “Similar sellers with this metric profile typically…”
- Automated improvement suggestions
- Real-time benchmarking vs category peers
How to prepare: Embrace data-driven management now. Use tools that provide analytics and trends, not just raw numbers.
Stricter Quality Standards
Amazon is gradually tightening performance thresholds, especially for growing categories.
Observed trends:
- ODR threshold may drop from 1% to 0.8% in some categories
- Valid tracking rate increasing from 95% to 97%
- Customer service response time expectations decreasing
- Return rate becoming explicit account health factor
Adaptation strategy: Don’t operate near thresholds. What’s acceptable today may be violation tomorrow. Build in safety margins.
Sustainability and Environmental Performance
Amazon’s Climate Pledge Friendly and sustainability initiatives are expanding.
Emerging account health factors:
- Packaging waste metrics
- Carbon footprint scores
- Sustainability certifications
- Excess inventory disposal methods
While not yet part of official account health, these may influence seller ranking and Buy Box eligibility soon.
Category-Specific Performance Requirements
Amazon is moving toward differentiated standards by category.
Examples:
- Electronics: Stricter defect rate requirements (complexity)
- Consumables: Faster shipping expectations (repeat purchases)
- Hazmat: Enhanced documentation and compliance
- Luxury: Authentication and quality verification
Pro Tip: Join category-specific seller groups and forums. Early adopters of category requirements often have advantages before standards become universal.
Your Account Health Action Plan: 30 Days to Bulletproof Status
Turn knowledge into results with this implementation roadmap.
Week 1: Audit and Baseline
Day 1-2: Complete account health assessment
- Screenshot current metrics (baseline)
- Review 60-day history for trends
- Identify weakest metrics
- Check for pending issues (claims, messages, returns)
Day 3-4: Process documentation audit
- Document current shipping workflow
- Review customer service procedures
- Analyze quality control (or lack thereof)
- Identify gaps and vulnerabilities
Day 5-7: Tool setup
- Choose monitoring tool (FeedbackWhiz, ManageByStats, or similar)
- Set up alerts for critical thresholds
- Create weekly tracking spreadsheet
- Establish daily review ritual
Week 2: Quick Wins and Low-Hanging Fruit
Day 8-10: Fix obvious issues
- Resolve all stranded inventory
- Update handling times if too aggressive
- Fix any listing errors
- Clear pending customer messages
Day 11-12: Shipping optimization
- Integrate shipping software if not using
- Audit tracking upload process
- Test backup shipping options
- Set up automatic tracking notifications
Day 13-14: Customer service improvement
- Create response templates for common issues
- Set up auto-responders
- Enable mobile notifications for messages
- Establish <12 hour response goal
Week 3: Systemic Improvements
Day 15-17: Quality control implementation
- Create inspection checklist
- Document packaging standards
- Source better packaging materials if needed
- Train team (or yourself) on standards
Day 18-20: Inventory management
- Audit slow-moving inventory
- Create liquidation plan for aged stock
- Set up reorder points and alerts
- Review forecasting accuracy
Day 21: FBA evaluation
- Calculate ROI of FBA for top 10 SKUs
- Consider hybrid strategy if pure FBM
- Plan FBA transition if appropriate
Week 4: Monitoring and Optimization
Day 22-24: Feedback and review management
- Set up automated feedback requests
- Create review monitoring system
- Develop negative feedback response protocol
- Request removal of any violating feedback
Day 25-27: Performance tracking setup
- Finalize weekly scorecard
- Establish monthly review process
- Set up team accountability (if applicable)
- Document all SOPs
Day 28-30: Testing and refinement
- Test all new processes with real orders
- Measure improvement in key metrics
- Adjust systems based on results
- Plan next month’s focus areas
Expected results after 30 days:
- All metrics in “green” healthy zone
- Established monitoring systems
- Documented processes
- Confidence in long-term sustainability
Pro Tip: Don’t try to fix everything simultaneously. Pick your weakest metric and focus 80% of effort there. Once it’s stable, move to the next one. Sequential focus beats scattered effort.
Final Thoughts: Account Health as Your Sustainable Competitive Advantage
Here’s what most Amazon sellers don’t realize: account health is the most sustainable competitive advantage you can build.
Products can be copied. Prices can be undercut. Keywords can be outbid. Reviews can be manipulated (though don’t do that). But exceptional account health? That requires operational excellence that competitors can’t replicate overnight.
When your account health is bulletproof:
- You win Buy Box even at higher prices
- Your rankings are stable and algorithmic penalties don’t exist
- You can scale aggressively without fear
- Amazon’s algorithm rewards you with better visibility
- You sleep soundly knowing one bad week won’t destroy your business
Account health isn’t sexy. It’s not a growth hack or a secret tactic. It’s boring operational excellence—shipping on time, responding to messages quickly, inspecting products carefully, managing inventory wisely.
But boring wins. Consistency compounds. Reliability beats brilliance.
Your competitors are chasing the next big opportunity, the hot product, the ranking hack. Meanwhile, you’re building systems that make success inevitable and sustainable.
The irony? Focusing on account health often improves sales MORE than focusing on sales themselves. Because Amazon rewards reliable sellers with visibility, and visibility drives sales.
Start today. Open your Account Health dashboard. Check your metrics. If anything is yellow or red, you know what to do. If everything’s green, establish the systems to keep it that way.
Three months from now, you’ll either have bulletproof account health protecting your rankings and revenue… or you’ll be one bad week away from disaster.
The choice is yours. The playbook is in your hands.
Build systems. Monitor metrics. Execute consistently. Win sustainably.
Your account health isn’t just about survival—it’s about domination.
Frequently Asked Questions (FAQs)
What is Amazon account health and why does it matter?
Amazon account health is your seller performance scorecard measuring critical metrics like Order Defect Rate, late shipment rate, and customer service quality. It matters because poor account health directly impacts your search rankings, Buy Box eligibility, and can lead to account suspension. Amazon’s algorithm reduces visibility for sellers with poor performance metrics, even if your keyword rankings appear stable. Good account health (all metrics in “green”) is essential for sustainable Amazon success.
What is a good Order Defect Rate on Amazon?
Amazon’s threshold for Order Defect Rate (ODR) is below 1%, but you should target under 0.5% to maintain a healthy buffer. ODR combines negative feedback, A-to-z claims, and chargebacks. Operating near the 1% threshold is dangerous—one bad week could push you into suspension territory. Top-performing sellers maintain ODR between 0.2-0.4%, giving them significant cushion and positive algorithmic signals that improve rankings and Buy Box share.
How do I check my Amazon seller account health?
Navigate to Seller Central → Performance → Account Health. This dashboard shows real-time status of all critical metrics including ODR, late shipment rate, pre-fulfillment cancel rate, valid tracking rate, and more. Check this dashboard at least weekly, daily if you’re scaling fast or have had recent issues. Set up email alerts in Seller Central or use third-party tools like FeedbackWhiz or ManageByStats for automatic monitoring and notifications when metrics approach dangerous levels.
What happens if my Amazon account health goes to “At Risk”?
“At Risk” status means one or more metrics are approaching Amazon’s suspension thresholds. While you can still sell, Amazon has already begun algorithmically penalizing you with reduced search visibility, lower Buy Box share, and restricted access to promotional tools. You’ll receive warning emails from Amazon. If metrics don’t improve within the specified timeframe, your account will move to “Critical” status or face suspension. Act immediately when you hit “At Risk”—don’t wait for the situation to worsen.
How can I improve my Amazon seller performance score quickly?
Focus on executing “clean” orders that dilute bad metrics. The math works in your favor: if you have 0.9% ODR (dangerous) and execute 100 perfect orders, you’ll drop below 0.5% (safe). Quick improvements: (1) Switch high-volume products to FBA temporarily (eliminates late shipments), (2) Offer immediate refunds to unhappy customers before they leave negative feedback, (3) Increase handling time to ensure you never ship late, (4) Enable vacation mode briefly if necessary to stop order flow while fixing systemic issues. Monitor metrics daily during recovery.
What is IPI score and how do I improve it?
Inventory Performance Index (IPI) score (0-1000) measures how efficiently you manage FBA inventory. Scores below 350 trigger storage limits and overage fees. Improve IPI by: removing excess inventory (90+ days supply), improving sell-through rate through better conversion and promotions, fixing stranded inventory immediately, and maintaining in-stock rate above 80% for bestsellers. Prioritize liquidating slow movers even at a loss—the cost of low IPI (storage limits during peak season) far exceeds discount costs.
Does account health affect Amazon rankings?
Yes, significantly but indirectly. Poor account health metrics don’t directly change your keyword ranking position, but Amazon reduces how often your listing appears at that position (impression throttling). You might rank position 5 but only show 50% of the time. Poor account health also kills Buy Box eligibility, and without Buy Box, even top rankings generate minimal sales. Sellers with “At Risk” or “Critical” account health report 30-50% traffic drops despite stable rankings. Maintain “Healthy” status to protect organic visibility.
What is a dangerous late shipment rate on Amazon?
Amazon’s suspension threshold is 4% late shipment rate, but you should never exceed 2%. Operating at 3-3.5% puts you one bad week away from suspension. Top sellers maintain under 1% LSR. For FBM sellers, use conservative handling times (2 days even if you can ship in 1), have backup shipping plans, and consider FBA for high-volume products. Weekend and holiday order processing gaps are common LSR culprits—plan coverage in advance or enable vacation mode.
Can I recover from Amazon account suspension?
Yes, but it requires a strong Plan of Action (POA). Successful POA includes: (1) Specific root cause analysis (take responsibility, don’t blame others), (2) Immediate corrective actions already implemented with evidence, (3) Preventative measures ensuring the issue never recurs. Amazon receives thousands of POAs daily—generic templates get denied immediately. Be specific, provide evidence, and focus on solutions, not excuses. Many suspended accounts are reinstated within 2-7 days with a proper POA. Consider consulting Amazon suspension specialists for serious cases.
What’s better for account health: FBA or FBM?
FBA is significantly better for account health because Amazon handles fulfillment, eliminating late shipment issues and ensuring perfect tracking. FBA sellers typically have near-zero late shipment rates and valid tracking rates above 99%. However, FBA sellers must manage IPI score carefully. FBM gives you complete control but requires operational excellence—one vacation or busy week can tank your metrics. Best approach: use FBA for high-volume products and FBM only if you can maintain <2% late shipment rate consistently.
How often should I check my Amazon account health?
Check your account health dashboard weekly minimum, daily preferred if you’re actively growing or have had recent issues. Set up automated alerts through third-party tools (FeedbackWhiz, ManageByStats) so you’re notified immediately when metrics approach danger zones. Create a simple weekly scorecard tracking trends—improving or degrading metrics matter more than single data points. Monthly deep-dives (1-2 hours) should analyze patterns, review all defects/cancellations/returns, and update processes based on learnings.
What causes high Order Defect Rate?
Order Defect Rate (ODR) increases from: negative feedback (1-2 star seller feedback, not product reviews), A-to-z Guarantee claims (customers claiming non-delivery or significantly different item), and chargebacks (payment disputes). Common root causes: poor product quality from suppliers, inaccurate product descriptions creating unmet expectations, damaged items due to inadequate packaging, late or lost shipments, and poor customer service leading to escalations. Prevention: quality control before shipping, accurate listings, proactive customer communication, and immediate issue resolution.
How do I prevent account health issues during holidays?
Holiday season (Q4) challenges account health with massive volume increases and carrier delays. Protect yourself: (1) Add buffer to handling times in November, (2) Use premium shipping methods (speed over savings), (3) Move top products to FBA temporarily, (4) Hire seasonal help for fulfillment and customer service, (5) Over-communicate with customers about potential delays, (6) Process orders same-day regardless of cutoff times, (7) Monitor metrics daily not weekly. Better to pause selling briefly (vacation mode) than risk suspension from overwhelmed operations.
Can competitors sabotage my account health?
While competitors cannot directly access your account health metrics, they can indirectly damage them through: fake orders followed by A-to-z claims, false negative feedback, baseless SAFE-T claims, or hijacking your listings with counterfeit products. However, Amazon’s systems detect many of these patterns. Protect yourself: monitor new seller activity on your listings, enable two-factor authentication, use Brand Registry protections, document all suspicious activities, and promptly appeal obviously fraudulent feedback or claims. Most account health issues are operational, not competitive sabotage.
What’s the difference between seller feedback and product reviews for account health?
Seller feedback (1-5 stars on seller performance) directly impacts account health through Order Defect Rate—1-2 star feedback counts as defects. Product reviews (1-5 stars on product quality) do NOT impact account health metrics but affect conversion rates and rankings. Common mistake: sellers request removal of negative product reviews (Amazon won’t remove unless policy violation) when they should focus on negative seller feedback (removable if about product not seller performance). For FBA orders, Amazon-related issues should generate seller feedback removal requests.
How long does it take to improve account health metrics?
Metric improvement timeframes vary by measurement period: Order Defect Rate (60-day rolling) takes 60 days to fully clear old defects but improves incrementally with each clean order. Late Shipment Rate (10 & 30-day rolling) improves faster, showing significant changes within 2-3 weeks. IPI score updates weekly based on recent inventory management. Generally, expect 30-60 days for substantial metric improvements with perfect execution. Emergency improvements through clean order volume can show results in 7-14 days for short-measurement-period metrics.
Should I use vacation mode if my metrics are slipping?
Vacation mode can be a strategic tool when used correctly. Enable it when: you can’t fulfill orders for several days (vacation, emergency), your metrics are approaching danger zones and you need time to fix processes, or holiday volume will overwhelm your capacity. However, vacation mode stops all sales, so use sparingly. Better approach: fix root causes while operating rather than pausing. If you must pause, use the time productively—improve systems, clear inventory issues, update processes—not just waiting for metrics to age out.
How does account health affect Amazon PPC performance?
Poor account health indirectly hurts PPC by: reducing your Quality Score (Amazon’s version), increasing cost-per-click for same ad placements, reducing ad visibility even with competitive bids, and lowering conversion rates as customers see warning signals. Healthy account holders report 15-30% better PPC efficiency (lower ACoS) than sellers with “At Risk” status, even in identical product categories. Additionally, poor account health may restrict access to certain ad types (Sponsored Brands, DSP). Maintain healthy account status to maximize advertising ROI.
What tools help manage Amazon account health?
Essential tools: FeedbackWhiz ($20-100/mo) for automated feedback requests and alerts, ManageByStats ($29-199/mo) for customer service automation and performance tracking, Seller Legend ($47-197/mo) for comprehensive analytics dashboards, RestockPro ($79-399/mo) for IPI optimization and inventory forecasting. Free option: Amazon’s native Seller Central dashboard plus Google Sheets for manual tracking. Start with free tools if under $10K/month revenue. Upgrade to paid tools as you scale and need automation, alerts, and deeper analytics. Don’t over-tool—choose based on your weakest area.
What’s the relationship between account health and Buy Box?
Account health is a major Buy Box algorithm factor. Amazon prioritizes reliable sellers for Buy Box even if their price is slightly higher. Poor metrics impact Buy Box: ODR above 0.8% can cost you 30-50% Buy Box share, late shipment rate above 3% typically reduces Buy Box to under 50%, “At Risk” account status can eliminate Buy Box entirely. Conversely, excellent account health (ODR <0.3%, LSR <1%, all metrics green) often wins Buy Box against lower-priced competitors with worse metrics. Buy Box = sales, so account health directly impacts revenue regardless of rankings.
Additional Resources for Account Health Excellence
Official Amazon Resources:
- Amazon Seller Central Account Health – Your official dashboard
- Amazon Performance Policies – Official policy documentation
- Amazon Seller University – Free training on performance management
Account Health Tools:
- FeedbackWhiz – Automated feedback and review management
- ManageByStats – All-in-one seller analytics and alerts
- Seller Legend – Comprehensive performance tracking
Further Learning:
- Complete Amazon SEO Guide – How account health integrates with overall strategy
- ecomcrew Podcast – Regular account health and suspension discussions
- Amazon Seller Forums – Community support and troubleshooting
Your account health is your Amazon career insurance. Don’t wait for a crisis to take it seriously. Every successful long-term Amazon seller has one thing in common: obsessive attention to account health metrics. Start monitoring today, build bulletproof systems, and protect your rankings from preventable performance issues. For comprehensive understanding of how account health fits into your complete Amazon dominance strategy, explore the full Amazon SEO ecosystem guide. Master every element, dominate sustainably.
⚡ Amazon Account Health Dashboard
Professional Performance Monitoring Tool by SEOProJournal.com
Enter Your Performance Metrics
Order Defect Rate
Cancel Rate
Late Shipment Rate
Valid Tracking
IPI Score
Response Time
Overall Account Health Score
Amazon Performance Benchmarks
| Metric | Amazon Threshold | Recommended Target | Measurement Period |
|---|---|---|---|
| Order Defect Rate | < 1% | < 0.5% | Rolling 60 days |
| Pre-Fulfillment Cancel | < 2.5% | < 1% | Rolling 7 days |
| Late Shipment Rate | < 4% | < 2% | Rolling 10 & 30 days |
| Valid Tracking Rate | > 95% | > 98% | Rolling 30 days |
| IPI Score | > 350 | > 400 | Weekly update |
| Response Time | < 24 hours | < 12 hours | Ongoing |
Your Performance vs Targets
Improvement Strategies
Reduce Order Defects
Implement quality control checks, respond to customers within 12 hours, and offer immediate solutions before issues escalate.
Lower Cancel Rate
Use real-time inventory management, set buffer stock, and cancel fraudulent orders within 1 hour to avoid penalties.
Improve Shipping
Set conservative handling times, use Amazon Buy Shipping, and consider FBA for high-volume products.
Boost IPI Score
Remove excess inventory, improve sell-through rate with promotions, fix stranded inventory immediately.
Valid Tracking
Use integrated carriers, upload tracking within 2 days, and avoid manual entry errors with automation.
Faster Responses
Enable mobile notifications, use templates for common issues, and aim for 4-hour response time.
Powered by SEOProJournal.com
Protect Your Rankings Through Better Account Health Management
Related posts:
- SEO INDUSTRY ALERT: Major Study Exposes Authority Metric Manipulation Through Link Spam
- Amazon Backend Keywords 2025: Complete Guide to Hidden Search Terms That Boost Rankings
- Currency, Payment Methods, and SEO: Local Trust Signals That Matter
- Blog SEO: The 2025 Blueprint for High-Traffic Content Blogs (Dashboard)