Ever wonder why some products shoot to page 1 on Amazon while yours is buried on page 47, even though your product is arguably better?
Here’s the secret nobody talks about: Amazon sales velocity is the invisible force that separates the winners from the “also-rans.” It’s not just about making sales—it’s about making sales fast, consistently, and strategically.
Think of it like this: Amazon’s algorithm is like a popularity contest at a high school. The cool kids (high-velocity products) get all the attention, better locker spots (search rankings), and invites to all the parties (Buy Box, Best Seller badges). Meanwhile, products with slow sales velocity? They’re eating lunch alone in the library. 
The brutal truth? You could have the best product in your category, five-star reviews, and perfect SEO, but if your sales momentum Amazon style isn’t ramping up fast enough, you’re invisible.
Let me show you exactly how to crack the code, boost your velocity, and claim your spot on page 1 where the real money lives.
What Exactly Is Amazon Sales Velocity (And Why Should You Care)?
Let’s cut through the jargon.
Amazon sales velocity is simply the rate at which your product sells over a specific time period—usually measured daily or weekly. It’s your speed of sales, not just your total sales volume.
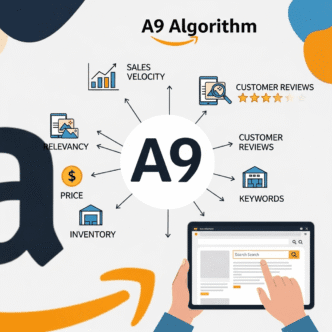
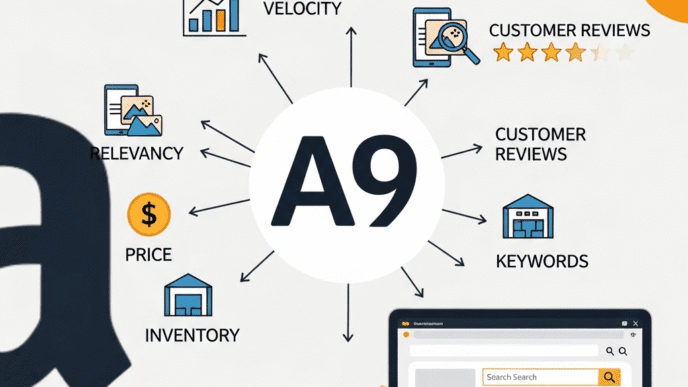
Here’s why it matters more than almost anything else: Amazon’s A9 algorithm is obsessed with velocity because it signals customer demand in real-time.
Think about it from Amazon’s perspective: They want to show customers products that are selling right now, not products that sold well six months ago. Fresh demand = higher rankings = more visibility = more sales. It’s a virtuous cycle.
The Velocity vs. Volume Confusion
Most sellers get this wrong. They think, “I need more total sales!” But Amazon cares more about your sales trajectory.
Example:
- Product A: 100 sales this month (steady 3-4 per day)
- Product B: 100 sales this month (10 in week 1, 20 in week 2, 30 in week 3, 40 in week 4)
Product B will rank higher because its velocity is increasing. That upward momentum tells Amazon, “This product is hot right now.”
Pro Tip: Amazon’s algorithm looks at multiple velocity windows simultaneously—last 24 hours, last 7 days, last 30 days. Consistent acceleration across all these timeframes delivers maximum ranking power.
How Does Sales Velocity Impact Your Amazon Rankings?
Here’s where it gets interesting (and profitable).
Sales velocity isn’t just one of the ranking factors—it’s arguably the most important one after relevance. Amazon has confirmed that “sales performance” heavily influences search position, and velocity is the core metric they track.
The Amazon Ranking Algorithm Breakdown
Amazon evaluates your product through multiple lenses:
- Relevance – Keywords, title, backend terms (30% weight)
- Performance – Sales velocity, conversion rate, reviews (50% weight)
- Customer satisfaction – Reviews, returns, Q&A (20% weight)
Notice that sales performance metrics dominate at 50%? That’s your velocity at work.
The Velocity-Ranking Feedback Loop
This is the game-changer most sellers miss:
Higher velocity → Better rankings → More visibility → More sales → Even higher velocity
It’s a compounding effect. Once you trigger this loop, growth becomes exponential. But breaking into it? That’s the challenge.
Real-world example: I worked with a supplement seller stuck at position 28 for “collagen powder.” We ran a 7-day lightning deal combined with PPC push. Sales jumped from 8/day to 47/day. Within 72 hours, organic ranking climbed to position 9. Two weeks later, maintaining 35/day velocity, they hit position 3.
The rankings stuck because the velocity sustained.
Why Is Increasing Amazon Sales Velocity So Difficult?
Let’s be honest—if boosting velocity were easy, everyone would be on page 1.
The challenge is the cold start problem. When you launch a new product or when sales stagnate, you’re invisible. No visibility = no sales = no velocity = no rankings = continued invisibility.
It’s like trying to get your first job that requires experience. How do you get experience without a job? How do you get velocity without visibility?
The Hidden Costs of Low Velocity
Beyond poor rankings, slow sales velocity creates cascading problems:
- Inventory stagnation – Tying up capital in slow-moving stock
- Storage fees – Amazon’s long-term storage charges kill profits
- Algorithm punishment – Amazon deprioritizes slow sellers
- Competitive disadvantage – Competitors with momentum pass you by
- Lower perceived value – Customers see low BSR and question quality
Low velocity isn’t just a symptom—it’s a disease that infects every aspect of your Amazon business.
Pro Tip: Amazon’s algorithm has a “recency bias”—recent sales velocity matters more than historical volume. A product that sold 1000 units last year but only 2/day this month will rank worse than a newer product selling 10/day consistently.
How to Increase Sales Velocity on Amazon: The Complete Strategy
Alright, enough theory. Let’s talk tactics that actually move the needle.
Strategy #1: The Launch Velocity Surge
Your product launch is your best opportunity to establish high velocity patterns. Amazon gives new products a temporary ranking boost—but only if you capitalize on it with strong initial sales.
The 10-Day Launch Formula:
Days 1-3: Internal traffic (friends, family, email list)
- Goal: 10-20 sales minimum
- Builds initial reviews and velocity signal
Days 4-7: Promotional discounts + PPC blitz
- Goal: 30-50 sales daily
- Activates algorithm’s attention
Days 8-10: Optimize for conversion while maintaining volume
- Goal: Sustain 25+ daily sales
- Lock in ranking improvements
Pro Tip: Use Amazon’s “Subscribe & Save” option to artificially inflate early velocity. Even subscription sales count toward velocity metrics, and the recurring revenue creates consistent future velocity.
Strategy #2: Price Optimization for Maximum Velocity
Price isn’t just about profit margins—it’s a velocity lever.
Most sellers optimize for maximum profit per unit. Smart sellers optimize for maximum total profit through velocity.
The Sweet Spot Formula:
Test prices in $2-3 increments and track:
- Daily unit sales
- Conversion rate
- Total revenue
- Velocity improvement
Sometimes dropping price by 15% increases velocity by 80%, which triggers ranking improvements that more than compensate for the margin sacrifice.
Real numbers example:
| Price Point | Daily Sales | Daily Revenue | Rank Position | Monthly Profit |
|---|---|---|---|---|
| $29.99 | 12 | $359.88 | #38 | $2,160 |
| $26.99 | 22 | $593.78 | #18 | $4,620 |
| $24.99 | 31 | $774.69 | #9 | $6,510 |
The $24.99 price point delivers 3x the profit despite 16% lower margins because velocity skyrocketed, improving rankings and creating more organic sales.
Strategy #3: Amazon PPC as a Velocity Accelerator
Pay-per-click advertising isn’t just for immediate sales—it’s your velocity injection system.
Strategic PPC for velocity:
- Front-load your spend – Aggressive first 30 days
- Target high-converting keywords – Quality over quantity
- Use Auto campaigns – Discover hidden velocity opportunities
- Bid aggressively on branded terms – Protect your velocity from competitors
The key insight: PPC sales count toward organic velocity. When Amazon sees total unit movement (PPC + organic), it improves your organic rankings, which eventually reduces your dependence on PPC.
Pro Tip: Run “day-parting” strategies—increase bids during high-conversion hours (typically 7-9 PM EST) to maximize velocity during peak shopping windows. This concentrated velocity signals strength to the algorithm.
Strategy #4: External Traffic Injection
Amazon loves when you bring external traffic to the platform. It’s free customers for them, and they reward you with ranking boosts.
External traffic sources ranked by velocity impact:
- Facebook/Instagram ads – Highly targeted, trackable
- Influencer partnerships – Authentic recommendations drive high conversion
- Email marketing – Your owned audience, best ROI
- YouTube reviews – Long-tail traffic that converts well
- TikTok viral campaigns – Explosive potential but unpredictable
The attribution challenge: Use Amazon Attribution links (available for Brand Registry sellers) to track external traffic performance. Amazon gives ranking credit when they can verify external sources.
Strategy #5: The Lightning Deal Velocity Spike
Amazon’s Lightning Deals are velocity rocket fuel when used strategically.
When to use Lightning Deals:
- Product launch (days 3-5)
- Breaking into page 1 (when you’re stuck at position 12-25)
- Seasonal peaks (maximizing high-demand periods)
- Inventory liquidation (turning stock into velocity)
The math: Lightning Deals typically cost $150-500 but can generate 200-500+ units in 6 hours. That’s concentrated velocity that significantly impacts your daily and weekly velocity metrics.
Pro Tip: Schedule Lightning Deals for Thursday or Friday. Weekend sales momentum carries into the next week, creating sustained velocity improvements that last beyond the promotion.
Strategy #6: Conversion Rate Optimization (The Force Multiplier)
This is the most overlooked velocity strategy: improving your conversion rate is mathematically identical to increasing traffic.
If you double your conversion rate from 10% to 20%, you’ve effectively doubled your velocity without spending more on advertising.
High-impact conversion optimization tactics:
- Image optimization – Professional photos increase conversions 40-60%
- Video content – Products with video convert 80% better
- Enhanced Brand Content – A+ content lifts conversions 5-10%
- Review generation – Each additional review (up to 50) improves conversion
- Title optimization – Clear benefit-driven titles convert better
For more details on conversion optimization, check out this comprehensive Amazon SEO guide that covers the full ecosystem.
What Is Unit Session Percentage and How Does It Affect Velocity?
Let’s talk about Amazon’s secret conversion metric: unit session percentage (USP).
This is your conversion rate on steroids. USP = (Units ordered ÷ Sessions) × 100
Why USP Matters More Than Regular Conversion Rate
Traditional conversion rate counts transactions. USP counts units. If someone buys 3 of your product in one session, that’s 300% USP.
Amazon’s algorithm LOVES high USP because:
- It indicates strong demand
- It means higher revenue per customer
- It suggests product-market fit
Typical USP benchmarks by category:
| Category | Average USP | High Performer USP |
|---|---|---|
| Supplements | 8-12% | 18%+ |
| Electronics | 5-8% | 15%+ |
| Kitchen | 10-15% | 22%+ |
| Clothing | 6-10% | 16%+ |
| Toys | 12-18% | 25%+ |
How to Improve Your Unit Session Percentage
Tactic #1: Multi-unit discounts “Buy 2, Save 5%” or “Buy 3, Save 10%” triggers higher USP by encouraging larger orders.
Tactic #2: Smaller pack sizes Counterintuitively, offering smaller quantities can increase USP. A customer buying 2 bottles of 60-count supplements (120 units total) generates higher USP than buying 1 bottle of 120-count.
Tactic #3: Gift-ready packaging Products marketed as gifts naturally have higher USP (people buy multiple for different recipients).
Pro Tip: Check your Business Reports in Seller Central for USP data. If your USP is below category average, conversion optimization should be your #1 priority before spending more on traffic.
How to Maintain Consistent Amazon Sales Velocity Long-Term
The hardest part isn’t achieving high velocity—it’s sustaining it.
Many sellers spike velocity during launches or promotions, then watch rankings collapse when sales normalize. Here’s how to avoid the velocity rollercoaster.
Building a Velocity Maintenance System
Weekly velocity audit:
- Monitor daily sales rate (set baseline expectations)
- Track ranking positions for top keywords
- Review USP and conversion trends
- Identify velocity warning signs early
Monthly optimization cycle:
- Refresh underperforming PPC campaigns
- Update images/content for seasonal relevance
- Launch targeted promotions if velocity drops
- Expand to adjacent keywords for traffic diversification
Pro Tip: Create a “velocity dashboard” in Excel or Google Sheets tracking: daily units sold, daily page views, conversion rate, USP, and top 5 keyword rankings. Review daily. Patterns emerge quickly.
The Inventory-Velocity Balance
Here’s a mistake that kills velocity: running out of stock.
When you go OOS (out of stock), Amazon doesn’t just pause your listing—it resets your velocity history. You’re starting over from scratch.
Inventory rules for velocity protection:
- Maintain 60+ days of stock at current velocity
- Factor in lead time + 30-day buffer
- Use Amazon’s restock tools (imperfect but helpful)
- Have backup suppliers for fast replenishment
- Monitor Stranded Inventory report weekly
The restocking opportunity: Smart sellers use restocking as a velocity injection point. When you restock, run a 2-3 day promotion to spike velocity, signaling to Amazon that demand is strong.
Strategies to Boost Amazon Product Sales Fast (Emergency Tactics)
Sometimes you need to move fast. Rankings are slipping, or competitors are eating your lunch.
Here are emergency velocity injection tactics:
Emergency Tactic #1: The 48-Hour Flash Sale
Run a steep discount (30-40% off) for exactly 48 hours. Promote via:
- On-listing coupons (visible in search)
- Social media to your audience
- Email blast to past customers
- Retargeting ads to cart abandoners
Goal: Generate 5-10x your normal daily velocity to shock the algorithm into ranking reassessment.
Emergency Tactic #2: The Review Generation Blitz
Low reviews kill velocity by tanking conversion. If you’re under 25 reviews, prioritize review generation:
- Amazon Vine program (if Brand Registered)
- “Request a Review” button in Seller Central
- Follow-up email sequences (within TOS)
- Insert cards (if compliant)
Important: Never buy fake reviews or violate Amazon TOS. The velocity gains aren’t worth the account suspension risk.
Emergency Tactic #3: The Bundle Strategy
Create urgency and increase perceived value by bundling:
- Product + complementary accessory
- 2-pack or 3-pack with discount
- Limited edition bundle (seasonal angle)
Bundles often rank in less competitive spaces while building velocity that impacts your main listing’s authority.
Pro Tip: Use “Virtual Bundles” if you’re not Brand Registered. You can create bundles from existing ASINs without creating new inventory, giving you velocity from multiple sources.
Amazon Sales Rank Optimization: Understanding the Connection
Your Best Sellers Rank (BSR) and velocity are intimately connected but not identical.
BSR is your position in a category based on recent sales history. It updates hourly.
Velocity is your rate of sales. It influences BSR but also directly impacts search rankings independently.
The BSR-Velocity Relationship
High velocity → Low BSR number (good) Low velocity → High BSR number (bad)
But here’s the twist: search rankings and BSR don’t always align. You can have a mediocre BSR (#15,000) but rank on page 1 for your main keywords if your keyword-specific velocity is strong.
Focus hierarchy:
- Keyword-specific sales velocity (most important)
- Overall sales velocity (important)
- BSR (nice to have, not critical)
Don’t obsess over BSR. Obsess over velocity for your target keywords.
How to Interpret BSR for Competitive Analysis
Use competitors’ BSR to estimate their velocity:
BSR estimation formulas (approximate):
| Category | BSR | Estimated Daily Sales |
|---|---|---|
| Supplements | #1,000 | 80-120 units |
| Supplements | #5,000 | 25-40 units |
| Supplements | #10,000 | 12-20 units |
| Electronics | #1,000 | 60-90 units |
| Electronics | #5,000 | 20-30 units |
These estimates help you understand the velocity target you need to hit to compete at specific ranking levels.
Pro Tip: Use tools like Helium 10 or Jungle Scout that reverse-engineer BSR into estimated sales numbers. This competitive intelligence guides your velocity goals.
Real-World Case Study: 30-Day Velocity Transformation
Let me walk you through an actual velocity optimization project that tripled sales.
The Product: Stainless Steel Water Bottle
Starting position (Day 0):
- Daily sales: 8 units
- Main keyword rank: Position 47
- BSR: #28,450 in Kitchen
- Monthly revenue: $2,400
- Reviews: 18 (4.3-star average)
The problems:
- Low visibility due to poor ranking
- Weak conversion (7% USP)
- Zero external traffic
- No promotions or marketing
The 30-Day Velocity Plan
Week 1: Foundation
- Redesigned all 7 product images (professional shoot)
- Created A+ content
- Optimized title and bullets for target keywords
- Launched “Request a Review” campaign
- Result: USP increased to 11%, sales to 12/day
Week 2: Traffic Injection
- Launched Sponsored Product campaigns ($40/day budget)
- Created Facebook ad campaign to Amazon listing
- Ran 7-day coupon (20% off) visible in search
- Contacted micro-influencers for posts
- Result: Sales jumped to 34/day, rank improved to position 28
Week 3: Momentum Maintenance
- Reduced discount to 15% to improve margins
- Expanded PPC to defensive keywords
- Published YouTube unboxing review
- Added Subscribe & Save option
- Result: Sustained 38/day, rank climbed to position 14
Week 4: Optimization & Scale
- Reduced coupon to 10%
- Optimized PPC based on week 2-3 data
- Launched Lightning Deal (500 units in 4 hours)
- Improved product description based on Q&A insights
- Result: Post-Lightning Deal velocity settled at 45/day, rank hit position 6
The Results After 30 Days
- Daily sales: 8 → 45 units (462% increase)
- Main keyword rank: #47 → #6 (top of page 1)
- BSR: #28,450 → #3,200
- Monthly revenue: $2,400 → $13,500
- Reviews: 18 → 47
- Total investment: $2,800 (images, PPC, promotions)
- ROI: 394% in first month
The key insight: Each week’s improvements compounded. Better images improved conversion, which made PPC more efficient, which increased velocity, which improved rankings, which reduced PPC dependence.
That’s the sales momentum Amazon style in action.
Tools and Metrics for Tracking Sales Velocity Performance
You can’t optimize what you don’t measure. Here are the essential tools and metrics.
Essential Velocity Tracking Metrics
Primary metrics (check daily):
- Units sold – Raw velocity number
- Page views – Traffic indicator
- Unit Session Percentage – Conversion health
- Daily revenue – Profitability check
- Top keyword rankings – Visibility tracker
Secondary metrics (check weekly):
- PPC ACoS – Advertising efficiency
- Organic vs. PPC ratio – Long-term sustainability
- Review velocity – Social proof accumulation
- Return rate – Product-market fit signal
- BSR trend – Overall category performance
Top Tools for Velocity Optimization
| Tool | Primary Function | Price | Best For |
|---|---|---|---|
| Helium 10 | Keyword tracking, sales estimates | $97-397/mo | Comprehensive analytics |
| Jungle Scout | Sales estimation, product research | $29-84/mo | Beginners, budget-friendly |
| Viral Launch | Launch management, kinetic PPC | $69-199/mo | Product launches |
| Sellics | All-in-one profit dashboard | $67-477/mo | Established sellers |
| AMZScout | Chrome extension, quick estimates | $0-50/mo | Quick competitor analysis |
Pro Tip: You don’t need every tool. Start with Helium 10’s free plan + Amazon’s native Business Reports. Add premium tools only when you’re doing $10K+/month and need deeper insights.
Using Amazon’s Native Analytics
Don’t overlook the free data in Seller Central:
Business Reports → Detail Page Sales and Traffic
- Sessions, units, conversion rate
- Compare time periods to spot velocity trends
Advertising Reports → Campaign Performance
- ACoS by keyword
- Impressions and click-through rate
Brand Analytics (if Brand Registered)
- Search terms report (goldmine for keyword velocity)
- Demographics and market basket analysis
Set up weekly reports that auto-deliver to your email. Consistency in monitoring creates competitive advantage.
The Psychology Behind Sales Velocity (Why It Works)
Understanding why velocity works helps you leverage it better.
Amazon’s Algorithmic Philosophy
Amazon’s mission: “Show customers what they want to buy, as fast as possible.”
High velocity products are low-risk recommendations for Amazon. If 50 people bought your product yesterday, it’s statistically likely the 51st person will be satisfied too.
It’s a trust proxy. Amazon trusts high-velocity products to deliver good customer experiences, so they get preferential visibility.
The Social Proof Cascade
Humans are hardwired to follow the crowd. When we see a product with high sales (indicated by many reviews, BSR badges, “X bought in past month”), we perceive:
- Safety – “Other people vetted this”
- Quality – “It must be good if it’s popular”
- Urgency – “I might miss out if I don’t act”
This creates a self-reinforcing cycle where velocity begets more velocity through psychological triggers.
Pro Tip: Use “social proof elements” in your listing—”#1 Best Seller,” “Amazon’s Choice,” “X bought in past month”—to leverage existing velocity for even more velocity. These badges are earned through sustained high velocity performance.
Common Sales Velocity Mistakes That Tank Your Rankings
Let me save you from the painful lessons I’ve learned (and seen others learn).
Mistake #1: The Promotion Addiction
Running constant discounts to maintain velocity is a death spiral.
Why it fails:
- Trains customers to wait for sales
- Destroys profit margins
- Creates unsustainable velocity
- Attracts low-quality, high-return customers
Better approach: Run strategic, time-limited promotions quarterly. Build velocity through value, not discounts.
Mistake #2: Ignoring Profitability for Velocity
Some sellers chase velocity at any cost, selling below break-even.
This is startup-thinking (“growth at all costs”) applied incorrectly to Amazon. Unlike VC-funded startups, you need profitability.
The sustainable formula: Velocity × Margin = Business Success
Don’t sacrifice 50% margins for 30% velocity gains. Find the optimization point where both are strong.
Mistake #3: Launch Velocity Without Conversion Optimization
Driving traffic to a poor-converting listing is like filling a leaky bucket.
Sequence matters:
- First: Optimize conversion elements (images, copy, pricing)
- Second: Drive traffic for velocity
- Third: Scale what works
Reversing this order wastes money and creates temporary velocity that doesn’t stick.
Mistake #4: Neglecting Post-Sale Velocity
Many sellers focus exclusively on initial sales velocity, ignoring repeat purchase velocity.
Repeat purchase strategies:
- Subscribe & Save (auto-refill products)
- “Request a Review” → “Buy again” email sequence
- Product inserts suggesting related products
- Bundling consumables together
For consumable products, repeat purchases can represent 30-60% of long-term velocity. Don’t leave this on the table.
Pro Tip: Calculate your “velocity retention rate”—what percentage of customers repurchase within 90 days. If it’s under 10% for a consumable, you have a product quality or customer experience problem.
Advanced Velocity Hacks the Pros Use
Ready for some next-level strategies?
Hack #1: The Seasonal Surge Strategy
Ride seasonal waves to build momentum that persists year-round.
Example: A yoga mat seller typically does 15 units/day. Every January (New Year resolution season), they run aggressive campaigns, pushing to 80 units/day for 3 weeks.
Result: Post-surge baseline settles at 25 units/day (not 15), because the ranking improvements from the surge create sustained visibility.
Application: Identify your product’s “high season” and dominate it with concentrated velocity efforts. Use the ranking gains as your new baseline.
Hack #2: The Complementary ASIN Boost
Amazon’s algorithm connects related products. When one of your products has high velocity, it can lift your entire catalog.
Strategy:
- Identify your easiest product to rank (least competitive keyword)
- Push massive velocity on that product
- Use “Frequently Bought Together” and “Sponsored Products” to connect to other catalog items
- Watch the halo effect lift all related products
This is how brands with 5-10 products can dominate categories—one velocity anchor pulling up everything else.
Hack #3: The Geographic Velocity Stacking
Different regions have different purchasing patterns. Some geographic areas convert better for specific product types.
Advanced tactic: Use PPC geo-targeting to identify your highest-converting states/cities. Then run targeted Facebook ads to those specific areas, creating concentrated velocity spikes.
Amazon’s algorithm notices geographic “hot spots” and may surface your product more in those regions organically, creating localized velocity dominance.
Pro Tip: Check your Business Reports → Geographic Sales. If California represents 30% of your sales, double down on California-specific marketing for even higher localized velocity.
How Improved Amazon Sales Rank Quickly: The Sprint Method
When you need fast results—maybe a competitor is eating your lunch or inventory is aging—use the Sprint Method.
The 7-Day Velocity Sprint
This is an intensive, short-term push designed to force algorithmic reconsideration of your product.
Monday-Wednesday: Setup
- Lower price 15-20%
- Launch visible coupon (additional 10%)
- Set up retargeting ads for cart abandoners
- Email your list with urgency messaging
Thursday-Friday: Acceleration
- Increase PPC budget 200-300%
- Post to relevant Facebook groups (within rules)
- Reach out to micro-influencers for immediate posts
- Run giveaways (Amazon TOS compliant)
Saturday-Sunday: Maximum Push
- If possible, secure a Lightning Deal slot
- Push all remaining promotional levers
- Monitor hourly and adjust bids real-time
Goal: Generate 7-10x your normal velocity for 3-4 consecutive days. This concentrated burst triggers algorithmic attention.
Post-sprint: Gradually reduce discounts over 3-5 days. Don’t cut cold—the algorithm needs to see sustained velocity even as you normalize.
Expected outcome: Rank improvements of 10-30 positions within 7-10 days if executed correctly. Not a guarantee, but the pattern works consistently.
When to Use the Sprint Method
Good scenarios:
- Stuck at position 12-20 (so close to page 1)
- New competitor just leapfrogged you
- Product launch momentum stalled
- Inventory glut you need to move
Bad scenarios:
- You’re already #1-3 (diminishing returns)
- Product has fundamental flaws (fix conversion first)
- Can’t afford temporary margin compression
For more context on ranking factors beyond velocity, explore this comprehensive Amazon SEO guide to understand the full picture.
The Role of External Traffic in Amazon Sales Momentum
Bringing customers from outside Amazon is a velocity multiplier with special algorithmic benefits.
Why Amazon Loves External Traffic
When you drive Facebook users, Google searchers, or Instagram followers to Amazon, you’re delivering:
- New customer acquisition for Amazon (they love this)
- Demonstrated demand outside their ecosystem
- Lower customer acquisition cost for them
Amazon rewards external traffic with ranking boosts beyond just the velocity those sales create. It’s a bonus multiplier.
Best External Traffic Sources for Velocity
Tier 1: High-converting, trackable
- Facebook/Instagram ads with Amazon Attribution
- Influencer partnerships (YouTube, TikTok, Instagram)
- Email marketing to owned lists
Tier 2: Good volume, harder to track
- Google Ads
- Pinterest ads
- Reddit community marketing
Tier 3: Long-tail, slow burn
- SEO content driving blog traffic
- YouTube organic reviews
- Podcast sponsorships
Pro Tip: Use Amazon Attribution tags (available to Brand Registry sellers) on ALL external links. This tracking ensures Amazon credits you with the external traffic source, maximizing the ranking benefit beyond just velocity.
Building an External Traffic Funnel
The sustainable approach:
Stage 1: Awareness
- Social media content showing product in use
- Educational content solving customer problems
- Influencer discovery content
Stage 2: Consideration
- Detailed product reviews (blog, video)
- Comparison content
- User testimonials and case studies
Stage 3: Conversion
- Direct Amazon links with urgency
- Limited-time offers for external audience
- “Amazon exclusive” messaging
The mistake most sellers make: They jump straight to Stage 3 (buy now!) without building awareness and consideration. Build the funnel, and velocity becomes sustainable.
Maintaining Velocity During Stock Issues
Inventory problems are velocity killers. Here’s how to protect your momentum.
The Pre-OOS Emergency Protocol
When you see stock running low (under 30 days at current velocity):
Immediate actions:
- Expedite restock – Use air freight if necessary
- Reduce PPC spend – Preserve stock for organic sales (maintains velocity signal without burning inventory)
- Increase price slightly – Slows velocity without stopping it
- Turn off promotions – Remove coupons and deals
Goal: Stretch inventory until restock arrives while maintaining some velocity (even 40% of normal is better than zero).
The Post-OOS Recovery Plan
If you do run out, you’ve lost velocity momentum. Recovery requires an immediate surge:
Day 1 of restock:
- Run 30% off coupon
- Max out PPC budgets
- Email past customers
- Social media announcement
Days 2-7:
- Maintain aggressive promotion (20% off)
- Focus on review generation
- Monitor rankings obsessively
Pro Tip: When you go OOS, your ranking doesn’t immediately crater—there’s a 3-5 day grace period where Amazon maintains your position. If you can restock within this window with a surge strategy, you can minimize velocity loss.
Sales Performance Metrics That Predict Future Velocity
Certain metrics are leading indicators of velocity changes. Monitor these to stay ahead.
Leading Indicator #1: Sessions Growth Rate
If your daily sessions are increasing week-over-week, velocity increases typically follow within 7-14 days.
What to track: Session growth % week-over-week
Action threshold: If sessions drop 15%+ week-over-week, investigate immediately (ranking drop? Seasonal shift? PPC issues?)
Leading Indicator #2: Conversion Rate Trends
Conversion rate changes predict velocity shifts.
Rising conversion = Velocity about to increase (same traffic converts better)
Falling conversion = Velocity about to decrease (warning sign!)
Pro Tip: If conversion drops but sessions stay flat, you maintain velocity short-term, but rankings will eventually suffer. Fix conversion issues immediately.
Leading Indicator #3: PPC Impression Share
If your impression share on target keywords is declining, your organic velocity will follow within 2-3 weeks.
Why: Lower impressions = less visibility = fewer organic opportunities = velocity decline
Action: Increase bids or improve ad quality score to maintain impression share.
Leading Indicator #4: Review Velocity
The rate you’re accumulating reviews predicts sales velocity.
If you’re getting 5+ reviews per week, your velocity is likely healthy and sustainable. If you go 2-3 weeks without new reviews, velocity is probably soft.
Correlation: High review velocity ≈ high sales velocity
The Long-Term Velocity Game Plan
One-time surges are fun, but sustainable success requires a long-term system.
Building Your Velocity Sustainability Framework
Monthly strategic cycle:
Week 1: Analysis & Planning
- Review previous month’s velocity data
- Identify trends and anomalies
- Plan optimization priorities
- Set velocity targets for the month
Week 2: Execution
- Implement planned optimizations
- Launch new PPC campaigns
- Update content/images if needed
- Run scheduled promotions
Week 3: Monitoring & Adjustment
- Track results from week 2 changes
- Adjust underperforming tactics
- Double down on what’s working
- Monitor competitor movements
Week 4: Scaling & Preparation
- Scale successful strategies
- Prepare next month’s initiatives
- Restock inventory based on velocity projections
- Document learnings for future optimization
The Quarterly Velocity Review
Every 90 days, conduct a deep audit:
Velocity health check:
- Compare current velocity to 90 days ago
- Analyze velocity by traffic source (organic, PPC, external)
- Review profitability alongside velocity (the balance matters)
- Identify seasonal patterns
- Benchmark against competitors
Strategic adjustments:
- Retire low-ROI tactics
- Invest more in high-performing channels
- Test new velocity strategies
- Update annual projections
Pro Tip: Create a “velocity scorecard” with traffic lights: Green (velocity growing), Yellow (velocity flat), Red (velocity declining). This visual dashboard makes pattern recognition instant and keeps your team aligned.
Expert Insights on Amazon Sales Velocity
Let me share some wisdom from experienced Amazon sellers who’ve mastered velocity optimization.
“Most sellers think about sales in terms of revenue or profit. The real game is velocity. Once you crack the velocity code, revenue and profit follow automatically because rankings improve, organic traffic increases, and advertising becomes more efficient.” – Michael Chen, 8-Figure Amazon Seller
“The biggest mistake I see is inconsistent effort. Sellers run a promotion, see velocity spike, then do nothing for two months. Velocity is like going to the gym—consistency beats intensity. Better to maintain 80% effort year-round than 150% effort once per quarter.” – Jessica Rodriguez, Amazon Consultant
“Data beats intuition every time. I track velocity daily across all my products. When I see a 20% drop, I investigate immediately—don’t wait until it becomes a 50% drop. Early intervention prevents ranking catastrophes.” – David Park, Amazon Analytics Specialist
“External traffic changed my entire business. When I started driving Instagram followers to Amazon instead of just relying on Amazon’s internal traffic, my velocity doubled AND my cost per acquisition dropped. Amazon rewards you for bringing them new customers.” – Sarah Thompson, DTC Brand Owner
Platform Algorithm Updates and Velocity Impact
Amazon doesn’t announce algorithm changes like Google does, but they happen regularly. Here’s how to stay resilient.
Signs of Algorithm Shifts
Watch for these indicators that Amazon changed something:
- Sudden ranking changes across multiple products simultaneously
- Velocity drop without traffic drop (conversion algorithm change)
- Traffic drop without ranking change (impression algorithm change)
- Competitor movements that seem algorithmic, not tactical
Velocity-First Algorithm Resilience
The beauty of focusing on velocity: it’s algorithm-resistant.
No matter what Amazon changes in their ranking formula, high sales velocity will always be rewarded because it directly serves Amazon’s business goals (more sales = more fees for them).
Algorithm-proof velocity strategies:
- Focus on customer satisfaction (sustainable velocity)
- Diversify traffic sources (don’t rely solely on organic)
- Maintain healthy inventory levels (can’t lose velocity to stockouts)
- Continuous optimization (never coast)
Pro Tip: Join Amazon seller communities (Reddit’s r/FulfillmentByAmazon, Amazon Seller Forums, private Facebook groups) where algorithm changes are discussed quickly. Crowdsourced intelligence helps you adapt fast.
Velocity Optimization for Different Product Categories
Not all categories behave the same. Tailor your velocity approach.
High-Ticket Items ($100+)
Challenges:
- Longer consideration periods
- Lower natural velocity
- Higher customer acquisition costs
Velocity strategies:
- Focus on conversion optimization over traffic volume
- Leverage financing options (Amazon Affirm)
- Create exceptional content (video, A+ content)
- Build external authority (reviews, press mentions)
Benchmark: 5-10 units/day can dominate in high-ticket categories where most sellers do 1-2/day.
Consumables and Supplements
Opportunities:
- Repeat purchase velocity
- Subscribe & Save momentum
- Customer LTV optimization
Velocity strategies:
- Aggressive Subscribe & Save discounts (15-20%)
- Focus on repeat purchase rate
- Multi-SKU bundles
- Email marketing to past buyers
Benchmark: Need 30-50+ units/day to compete in most supplement categories due to high competition.
Seasonal Products
Challenges:
- Velocity concentrated in short windows
- Off-season velocity management
- Inventory timing complexity
Velocity strategies:
- Maximize peak season (go aggressive)
- Use off-season for reviews/optimization
- Create “year-round relevance” messaging
- Bundle with non-seasonal complementary products
Benchmark: Accept 80%+ of annual velocity in 2-3 months; maintain minimal presence off-season.
Commodity Products
Challenges:
- High competition
- Low differentiation
- Price-sensitive customers
Velocity strategies:
- Slight price advantage + better content
- Focus on reviews accumulation
- Build brand story (why you’re better)
- External traffic (escape the commodity comparison)
Benchmark: Velocity is everything here—even small edges compound dramatically in rankings.
Tools and Automation for Velocity Management
Scale your velocity optimization with smart tools and automation.
Essential Automation Workflows
Workflow #1: Daily Velocity Alert Set up automated reports that email you when:
- Daily sales drop 25%+ vs. 7-day average
- Main keyword rankings drop 5+ positions
- Conversion rate falls below threshold
- Inventory hits 30-day supply
Workflow #2: Automatic PPC Adjustments Use Amazon’s rules-based bidding or third-party tools to:
- Increase bids when velocity drops
- Decrease bids when ACoS exceeds target
- Pause keywords that don’t convert
- Scale keywords that perform well
Workflow #3: Inventory Reorder Triggers Automate purchase orders when:
- Current velocity × lead time = reorder point
- Seasonal surge detected (ahead of demand)
- Stockout risk exceeds threshold
Pro Tip: Use Zapier or Make (formerly Integromat) to connect Amazon Seller Central data to Google Sheets, Slack notifications, or email alerts. Automated monitoring catches velocity issues before they become ranking disasters.
Advanced Analytics Platforms
Beyond basic tools, consider enterprise solutions if you’re doing $50K+/month:
Seller Labs
- Profit tracking with velocity correlation
- Automated PPC optimization
- Inventory management
Teikametrics
- AI-powered bidding optimized for velocity
- Cross-platform analytics (Amazon + others)
- Predictive inventory
SellerApp
- Product intelligence
- Listing optimization suggestions
- Velocity forecasting
When to upgrade: If you’re manually managing 10+ SKUs and spending 10+ hours/week on analytics, automation pays for itself quickly.
The Psychology of Buying Velocity (Customer Behavior Insights)
Understanding why customers buy helps you engineer velocity.
Urgency and Scarcity Triggers
Customers buy faster when they perceive scarcity:
- “Only 3 left in stock” (Amazon’s automatic feature)
- “X bought in past month” (social proof + scarcity)
- Limited-time coupons (time scarcity)
- Seasonal relevance (relevance scarcity)
Velocity impact: Urgency can increase conversion rates 20-40%, directly boosting velocity.
Pro Tip: Never fake scarcity (violates TOS and damages trust), but do communicate real scarcity honestly. If you’re running low on inventory, that urgency is authentic and effective.
The Bandwagon Effect
People want what others want. This is why Amazon’s “Best Seller” badge is so powerful—it proves velocity to customers, which creates more velocity.
Leveraging social proof for velocity:
- Accumulate reviews quickly (velocity of social proof)
- Highlight “X bought in past month”
- Showcase any awards or media mentions
- Use customer photos in your listing
Decision Paralysis and SKU Strategy
Too many options kills velocity. When you offer 12 color variants, customers get overwhelmed and abandon.
Optimal SKU strategy:
- Start with 1-3 options maximum
- Use data to identify best sellers
- Retire slow-moving variants
- Keep your catalog focused
Velocity benefit: Fewer SKUs = concentrated velocity per SKU = better rankings for each.
International Expansion and Velocity Scaling
Once you dominate one marketplace, expand to multiply velocity.
Multi-Marketplace Velocity Strategy
Prioritization framework:
- US (Amazon.com) – Largest market, master this first
- UK (Amazon.co.uk) – English language, easier expansion
- Canada (Amazon.ca) – North American logistics synergy
- Germany (Amazon.de) – Largest European market
- Others – Japan, France, Italy, Spain, etc.
Velocity Transfer Strategies
What transfers:
- Product images (universal)
- Reviews (with translation)
- Listing structure and strategy
- Velocity tactics that worked
What doesn’t transfer:
- Keywords and SEO (language-specific)
- Competitive landscape (different in each market)
- Pricing strategies (different economics)
- Customer behavior patterns (cultural differences)
Pro Tip: Use Amazon’s “Build International Listings” tool to sync inventory across marketplaces. This prevents overselling and lets you test markets without massive inventory commitments. Initial velocity in new markets is easier when you’ve proven the product elsewhere.
Localization for Maximum Velocity
Don’t just translate—localize:
- Cultural adaptation – Images and lifestyle context
- Local sizing standards – Metric vs. imperial
- Payment preferences – Some markets prefer invoices
- Shipping expectations – Vary by country
Better localization = higher conversion = more velocity in international markets.
The Competitive Intelligence Advantage
Your competitors’ velocity insights can inform your strategy.
Reverse-Engineering Competitor Velocity
Tactic #1: BSR Monitoring Track competitors’ BSR daily. Dramatic improvements indicate velocity surges—investigate what they’re doing:
- Did they launch a promotion?
- New PPC campaign?
- Got featured somewhere?
- Product update?
Tactic #2: Review Velocity Analysis Check how fast competitors accumulate reviews:
- 5+ reviews/week = strong velocity
- 1-2 reviews/week = moderate velocity
- <1 review/week = weak velocity
This proxy helps estimate their sales without expensive tools.
Tactic #3: Price Monitoring Use tools like Keepa or CamelCamelCamel to track competitor pricing history. Price drops often indicate velocity pushes—watch what happens to their rankings.
Learning from Competitor Mistakes
Watch for these velocity-killing patterns in competitors:
- Stockouts – When they go OOS, accelerate your velocity push to steal rankings
- Price wars – If they drop price dramatically, they might be desperate for velocity (maybe you can outspend them on value, not price)
- Review crashes – If they get hit with negative reviews, their conversion tanks → velocity drops → opportunity for you
Pro Tip: Create a “competitive velocity dashboard” tracking your top 5 competitors’ BSR, review count, and pricing. Weekly reviews reveal patterns and opportunities faster than reactive monitoring.
The Velocity-Profitability Balance (Don’t Sacrifice Everything)
Here’s a truth bomb: velocity at the expense of profitability is a failed business.
Finding Your Optimal Velocity Point
There’s a sweet spot where velocity and margin balance:
Too slow: Low velocity = poor rankings = limited growth Too fast at low margins: High velocity = unprofitable = unsustainable
The formula: (Price – All Costs) × Velocity = Profit
Optimize for the product of velocity and margin, not just velocity alone.
When to Sacrifice Margin for Velocity
Good times:
- Product launch (establish market position)
- Breaking into page 1 (crossing critical threshold)
- Eliminating aging inventory (storage fees > margin loss)
- Defending against aggressive competitor
Bad times:
- Continuous operation (unsustainable)
- When already dominating (diminishing returns)
- To hit arbitrary sales goals (ego-driven)
Pro Tip: Calculate your “velocity floor”—the minimum daily sales rate needed to maintain profitable operations after all Amazon fees, PPC costs, and overhead. Never sustain velocity below this level through discounting. Better to optimize conversion or pivot products.
The LTV Perspective
For consumable products with repeat purchases, initial velocity can be lower-margin if customer LTV is strong:
Example math:
- Initial sale: $25, cost $18 = $7 profit (28% margin)
- Repeat purchases: 40% of customers, 3× over 12 months
- Effective LTV: $25 + ($25 × 3 × 0.4) = $55
- Effective margin: Much higher when viewed long-term
This justifies more aggressive initial velocity strategies because you’re acquiring customers, not just making transactions.
Emerging Trends in Amazon Sales Velocity (2025 and Beyond)
The velocity game keeps evolving. Here’s what’s coming.
AI-Driven Personalization Impact
Amazon’s increasing use of AI for personalized recommendations affects velocity:
What’s changing:
- Search results personalized to individual browsing history
- “Customers who bought X” becomes hyper-personalized
- Ad targeting gets more sophisticated
Velocity implications:
- Niche products can achieve higher velocity with right audiences
- Broad appeal matters less than deep appeal to specific segments
- Conversion optimization becomes even more critical
Action: Focus on understanding your core customer avatar deeply. Velocity within your niche matters more than broad, shallow velocity.
Voice Commerce and Velocity
Alexa shopping is growing slowly but steadily:
Velocity considerations:
- Voice shopping prioritizes top-ranked products (velocity winners dominate even more)
- Limited product comparison = conversion optimization critical
- Brand recognition matters (Alexa suggests brands she “knows”)
Preparation: Ensure your product titles are “voice-friendly” (natural language, not keyword-stuffed). Be ready for the voice commerce tipping point.
Sustainability and Social Responsibility
Eco-conscious products are seeing velocity advantages:
Amazon’s Climate Pledge Friendly badge = velocity boost
- Appears in search results
- Filters prioritize these products
- Conversion lift from conscious consumers
Action: If applicable, get certified for Amazon’s sustainability programs. The velocity advantages are measurable and growing.
Video Content Dominance
Products with video increasingly dominate velocity:
Current impact: +80% conversion improvement Future trajectory: Video might become expected, not just advantageous
Action: Invest in quality product videos now before it becomes table stakes. Early adopters in categories still gain velocity advantages.
Pro Tip: Follow Amazon’s official announcements and test new features early. Features like Posts, Livestreaming, and Brand Stories are velocity experiments—early adoption can provide temporary velocity edges.
Final Thoughts: Building Your Velocity Empire
Let’s bring this full circle.
Amazon sales velocity isn’t just another metric to track—it’s the master metric that governs your success on the platform. Rankings, visibility, profitability, growth potential—they all flow from velocity.
The sellers who win long-term are the ones who build systems for sustainable velocity, not just tactics for temporary spikes. They understand that velocity is both art and science: creative marketing combined with rigorous data analysis.
Here’s what separates the amateurs from the pros:
Amateurs: Run a promotion, get a sales spike, watch it fade, repeat Pros: Build compounding velocity engines that grow systematically month after month
Amateurs: Obsess over BSR and rankings Pros: Focus on the underlying velocity metrics that create good BSR and rankings
Amateurs: Compete on price alone Pros: Compete on value, conversion optimization, and strategic positioning
Amateurs: React to velocity drops after they happen Pros: Monitor leading indicators and prevent velocity issues before they manifest
Your path forward is clear:
- Audit your current velocity (where are you now?)
- Set realistic velocity targets (where do you need to be?)
- Implement the strategies from this guide systematically
- Measure obsessively and iterate constantly
- Scale what works and abandon what doesn’t
The beautiful thing about velocity? It compounds. Every improvement makes the next improvement easier. Higher velocity → better rankings → more organic traffic → even higher velocity → better rankings → and so on.
The loop feeds itself once you trigger it.
Start today. Pick one strategy from this guide—maybe it’s optimizing your images for conversion, launching a focused PPC campaign, or just setting up proper tracking—and implement it this week.
Velocity isn’t built overnight, but it’s built one day at a time.
Your competitors are reading guides like this too. The difference between you and them? Execution. Knowledge is everywhere. Action is rare.
Be the seller who acts.
Frequently Asked Questions (FAQs)
What is Amazon sales velocity and why does it matter?
Amazon sales velocity is the rate at which your product sells over a specific time period, typically measured daily or weekly. It matters because Amazon’s A9 algorithm uses velocity as a primary ranking factor—products with higher sales velocity get better search positions, more visibility, and increased organic traffic. It’s essentially Amazon’s way of identifying “hot” products that customers currently want, and rewarding them with preferential placement. Unlike total sales volume, velocity measures your momentum, which is a better predictor of future success.
How quickly can I increase my Amazon sales velocity?
You can see velocity improvements within 7-14 days using aggressive tactics like price optimization, PPC campaigns, and promotional coupons. However, sustainable velocity improvements typically take 30-60 days as you optimize multiple factors: conversion rate, external traffic, review accumulation, and ranking improvements. The fastest results come from combining multiple strategies simultaneously—improved images + PPC push + limited-time promotion can spike velocity within 48-72 hours, but maintaining that velocity requires ongoing optimization.
What’s a good daily sales velocity for Amazon?
This varies dramatically by category and price point. As a general benchmark: 10-15 daily units is solid for most mid-priced products ($20-50 range), 30-50 daily units positions you competitively in popular categories, and 100+ daily units typically indicates a top-performing product. However, in high-ticket categories ($100+), even 3-5 units/day can be excellent. Focus less on absolute numbers and more on your velocity relative to competitors—check their BSR and estimated sales using tools like Jungle Scout or Helium 10.
Does Amazon sales velocity affect my Best Sellers Rank (BSR)?
Yes, directly. BSR is calculated primarily based on recent sales velocity within your category. The algorithm weighs recent sales more heavily than historical sales—yesterday’s sales matter more than last month’s. However, BSR and search ranking aren’t identical. You can have a mediocre BSR but still rank well for specific keywords if your keyword-specific velocity is strong. Focus on velocity for your target keywords rather than obsessing over overall BSR, as keyword rankings drive actual traffic and sales.
How do I maintain sales velocity during slow seasons?
Maintain minimum velocity during slow periods by: running targeted PPC campaigns to sustain visibility, offering Subscribe & Save options for recurring revenue, creating “off-season relevance” messaging in your listing (e.g., yoga mats marketed for “at-home workouts” in winter), bundling with complementary products that don’t have seasonality, and using the slow period to accumulate reviews and optimize conversion. Accept that velocity will drop but focus on maintaining enough momentum to avoid starting from zero when your peak season returns. Even 30-40% of peak velocity keeps you algorithmically “warm.”
What’s more important: conversion rate or traffic for sales velocity?
Both are equally critical—they’re multiplicative factors. Velocity = Traffic × Conversion Rate. Improving either one by 50% has the same velocity impact, so focus on whichever is currently weakest. If you’re getting tons of traffic but low sales, optimize conversion (images, price, reviews). If conversion is strong but traffic is low, invest in PPC and SEO. The most successful sellers optimize both simultaneously, as they create a compounding effect: better conversion makes PPC more profitable, allowing more traffic investment, creating more sales, improving rankings, generating more organic traffic.
How does unit session percentage (USP) relate to sales velocity?
Unit session percentage is your conversion rate on steroids—it measures units sold per session rather than transactions per session. High USP directly drives velocity because it means each visitor generates more sales. Amazon’s algorithm loves high USP because it indicates strong product-market fit and efficient use of traffic. Improving USP from 10% to 15% effectively increases your velocity by 50% without needing more traffic. Optimize USP through: multi-unit discounts, smaller pack sizes that encourage multiple purchases, gift-worthy packaging, and compelling product bundles.
Can I use external traffic to boost Amazon sales velocity?
Absolutely, and Amazon actually rewards external traffic with additional ranking benefits beyond just the velocity those sales create. Driving traffic from Facebook, Instagram, Google, or influencer channels signals to Amazon that demand exists beyond their platform. Use Amazon Attribution links (for Brand Registry sellers) to track external traffic and ensure you get full algorithmic credit. The best external traffic strategies: Facebook/Instagram ads with compelling offers, influencer partnerships with authentic reviews, email marketing to your owned audience, and YouTube product reviews.
What happens to my sales velocity if I run out of stock?
Running out of stock is catastrophic for velocity. Your listing becomes unsearchable, all momentum stops, and worst of all, Amazon effectively resets your velocity history. When you restock, you’re starting from near-zero velocity, which tanks your rankings. Competitors steal your hard-won search positions. Recovery can take 2-4 weeks even with aggressive tactics. Prevent stockouts by: maintaining 60+ days inventory at current velocity, accounting for lead times plus buffers, using Amazon’s restock tools, and having backup suppliers. If a stockout is inevitable, reduce PPC and increase prices to stretch inventory while maintaining some velocity.
How do Amazon Lightning Deals impact sales velocity?
Lightning Deals are velocity rocket fuel when used strategically. They generate concentrated bursts of sales (often 200-500 units in 4-6 hours) that dramatically impact your daily and weekly velocity metrics. This surge signals strong demand to Amazon’s algorithm, often resulting in ranking improvements that persist after the deal ends. Best times to use Lightning Deals: during product launches (days 3-5), when stuck just below page 1 rankings (positions 12-25), during high-traffic periods (holidays, Prime Day), and for inventory liquidation. Cost is typically $150-500 but ROI includes both immediate revenue and lasting ranking benefits.
What’s the relationship between reviews and sales velocity?
Reviews and velocity have a bidirectional relationship. Higher velocity → more customers → more reviews (if you’re requesting them). More reviews → higher conversion rate → higher velocity. The multiplier effect is powerful: products with 50+ reviews typically convert 2-3x better than those with under 10 reviews. Review velocity (rate of accumulation) is also a ranking signal—products gaining 5+ reviews per week signal strong sales to the algorithm. Accelerate review accumulation through: “Request a Review” button in Seller Central, Amazon Vine program (Brand Registry), excellent customer service that naturally inspires reviews, and product insert cards (within TOS).
How do I know if my sales velocity is good enough to compete?
Use competitor analysis to establish your velocity benchmark. Tools like Helium 10, Jungle Scout, or AMZScout can estimate competitor sales based on BSR. Check the top 5-10 products in your niche and identify their estimated daily velocity. To compete on page 1, you typically need 60-80% of the velocity of products currently ranking positions 1-10. If the #5 product is doing 50 units/day, aim for 35-40 units/day as your initial target. Track your velocity against this benchmark weekly and adjust tactics until you reach competitive levels.
Can I increase velocity without spending money on ads?
Yes, but it’s slower and harder. Non-paid velocity strategies include: conversion rate optimization (better images, titles, pricing), review generation and management, external organic traffic (social media, SEO content, YouTube), product bundling and upsells, email marketing to past customers, optimizing for Amazon’s organic algorithm (backend keywords, A+ content), and improving your unit session percentage through strategic pricing. The challenge is that paid ads provide the fastest velocity boost while you’re building organic momentum. Most successful sellers use PPC initially, then gradually shift to more organic strategies as rankings improve.
What’s the best way to track and measure my sales velocity?
Use a combination of Amazon’s native tools and third-party platforms. Essential metrics to track daily: units sold (raw velocity), page views/sessions (traffic), unit session percentage (conversion), daily revenue, and top 5 keyword rankings. Tools: Amazon Seller Central Business Reports (free, comprehensive), Helium 10 or Jungle Scout (paid, advanced analytics), and custom Google Sheets dashboards pulling data from Amazon API. Set up automated daily reports that email you key metrics. Create a “velocity scorecard” with week-over-week and month-over-month comparisons to spot trends before they become problems.
How does pricing affect Amazon sales velocity?
Pricing is one of your most powerful velocity levers. Lower prices typically increase velocity by improving conversion rates and winning more Buy Box time, but the relationship isn’t linear. The goal is finding your optimal price point—the price that maximizes total profit through the combination of margin and velocity. Sometimes a 15% price drop increases velocity by 80%, dramatically improving rankings and creating net profit gains despite lower margins. Test price points systematically in $1-3 increments, tracking impact on: daily unit sales, conversion rate, total revenue, ranking position, and most importantly, total monthly profit. The “best” price balances velocity and profitability for your specific situation.
Should I focus on increasing sales velocity or improving profit margins?
This is a false dichotomy—successful sellers optimize both simultaneously, finding the balance point that maximizes total profit (margin × velocity). In specific situations, temporarily prioritize velocity: during launches (establish market position), when breaking into page 1 (crossing critical ranking threshold), clearing aging inventory (storage fees exceed margin loss), or defending against aggressive competitors. Prioritize margin when: already dominating rankings (top 3 positions), in low-competition niches, selling high-differentiation products, or when velocity is already strong. Calculate your “velocity floor”—minimum daily sales needed for profitable operations—and never sustain velocity below this through unprofitable discounting.
Additional Resources for Velocity Optimization
Amazon Official Resources:
- Amazon Seller University – Free training on sales optimization
- Amazon Advertising Console – PPC management for velocity
- Amazon Brand Registry – Unlock velocity-boosting features
Third-Party Tools:
- Helium 10 – Comprehensive analytics and velocity tracking
- Jungle Scout – Sales estimation and product research
- Keepa – Price and BSR history tracking
Learning Resources:
- Amazon SEO Complete Guide – How velocity fits into overall strategy
- Amazon Seller Forums – Community discussions on velocity tactics
- My Amazon Guy YouTube Channel – Advanced selling strategies
Analytics Platforms:
- Sellics – Profit dashboard with velocity correlation
- Viral Launch – Launch management and kinetic PPC
- SellerApp – AI-powered velocity forecasting
Your Velocity Action Plan Starts Now
Knowledge without action is just entertainment. You’ve got the playbook—now execute.
This week:
- Audit your current velocity (where are you?)
- Identify your biggest velocity bottleneck
- Implement ONE strategy from this guide
- Set up velocity tracking systems
This month:
- Optimize conversion elements
- Launch strategic PPC campaigns
- Test pricing for optimal velocity
- Monitor competitors and adjust
This quarter:
- Scale what’s working
- Expand to additional traffic sources
- Build sustainable velocity systems
- Dominate your category
The difference between page 1 and page 47 is velocity. The difference between six-figure sellers and seven-figure sellers? Systematic velocity optimization.
Stop leaving money on the table. Your products deserve to be seen. Your business deserves to grow.
Master velocity. Dominate rankings. Build your Amazon empire.
For more comprehensive strategies on optimizing your entire Amazon presence beyond just velocity, explore the complete Amazon SEO guide and learn how all ranking factors work together to create marketplace dominance.
Now get out there and build some serious momentum. Your future customers are waiting.